In depth profiling?
Hi! I'm working on a 3D endless runner. For generating the environment I designed my architecture to use the Object Pooling pettern for everything that I generate at runtime (environment, obstacles, collectables etc.) Absolutely nothing is instantiated at runtime. I'm having some spikes in my project:
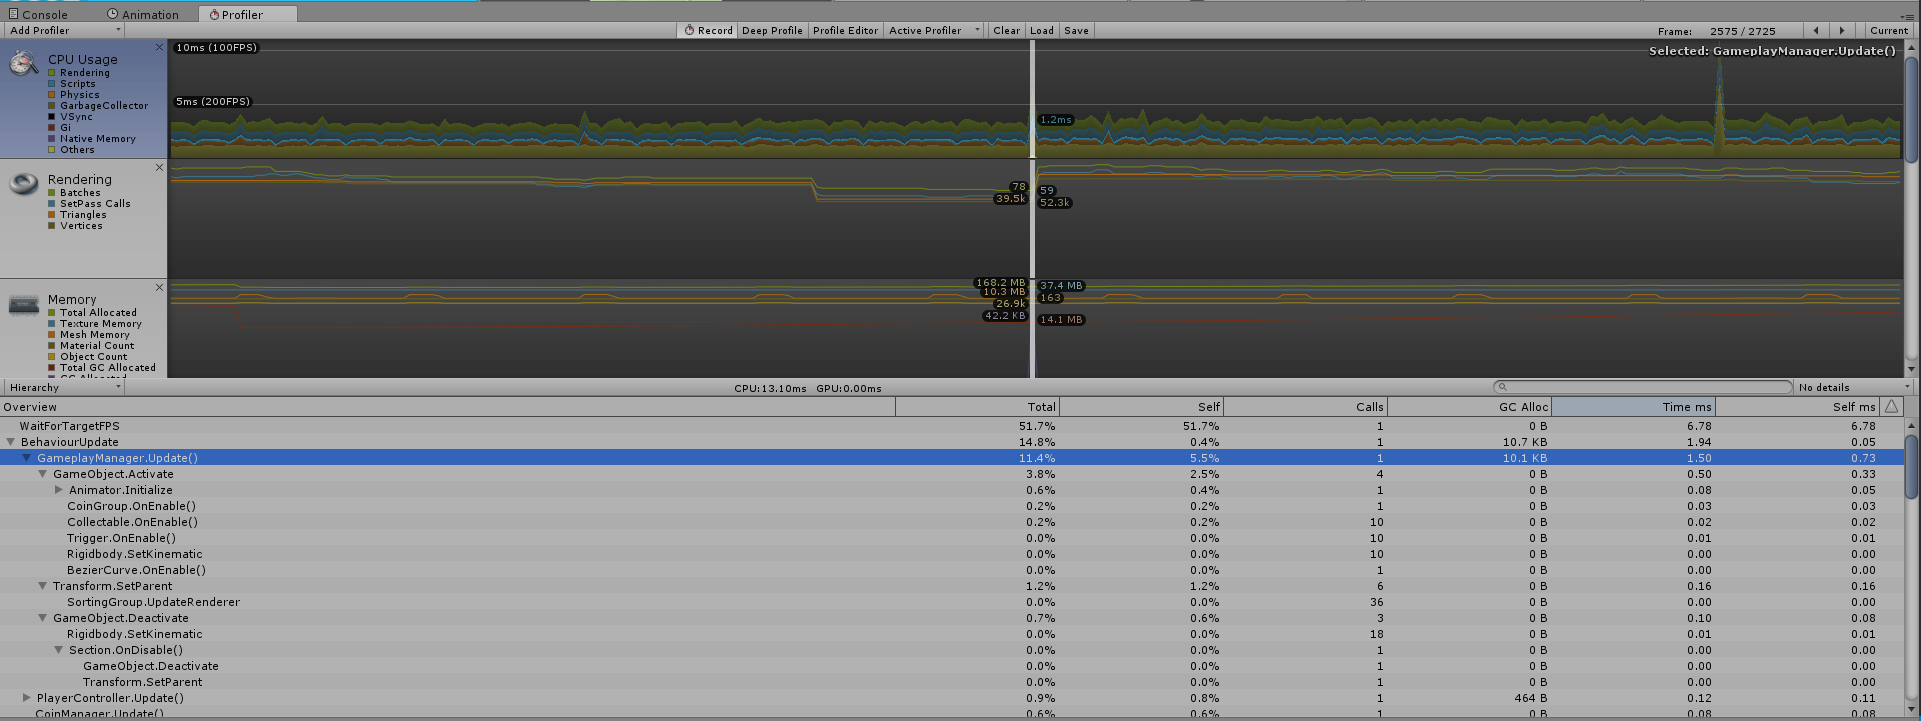
I can't figure out what causes the 10.1 KB GC Alloc from the profiler alone. My GameplayManager Update function has calls to many methods from various objects (Setting up environment, setting up obstacles, setting up collectables, setting up coins) (also, the part for generating envirnment etc. is not called every frame, only when the player completed a section - so about once in 20 seconds, ergo the spike occurs ~20 seconds apart).
Is there a way for figuring out what exactly causes the 10.1K GC Alloc, without having to debug myself by taking apart my code?
Thank you!
Yea. I managed to do this using:
 UnityEngine.Profiling.Profiler.BeginSample("code snippet name");
 // code here
 UnityEngine.Profiling.Profiler.EndSample();
This will add parts of my code in the profiler and I can pinpoint exactly where the issue occurs.
