- Home /
Profiler spikes
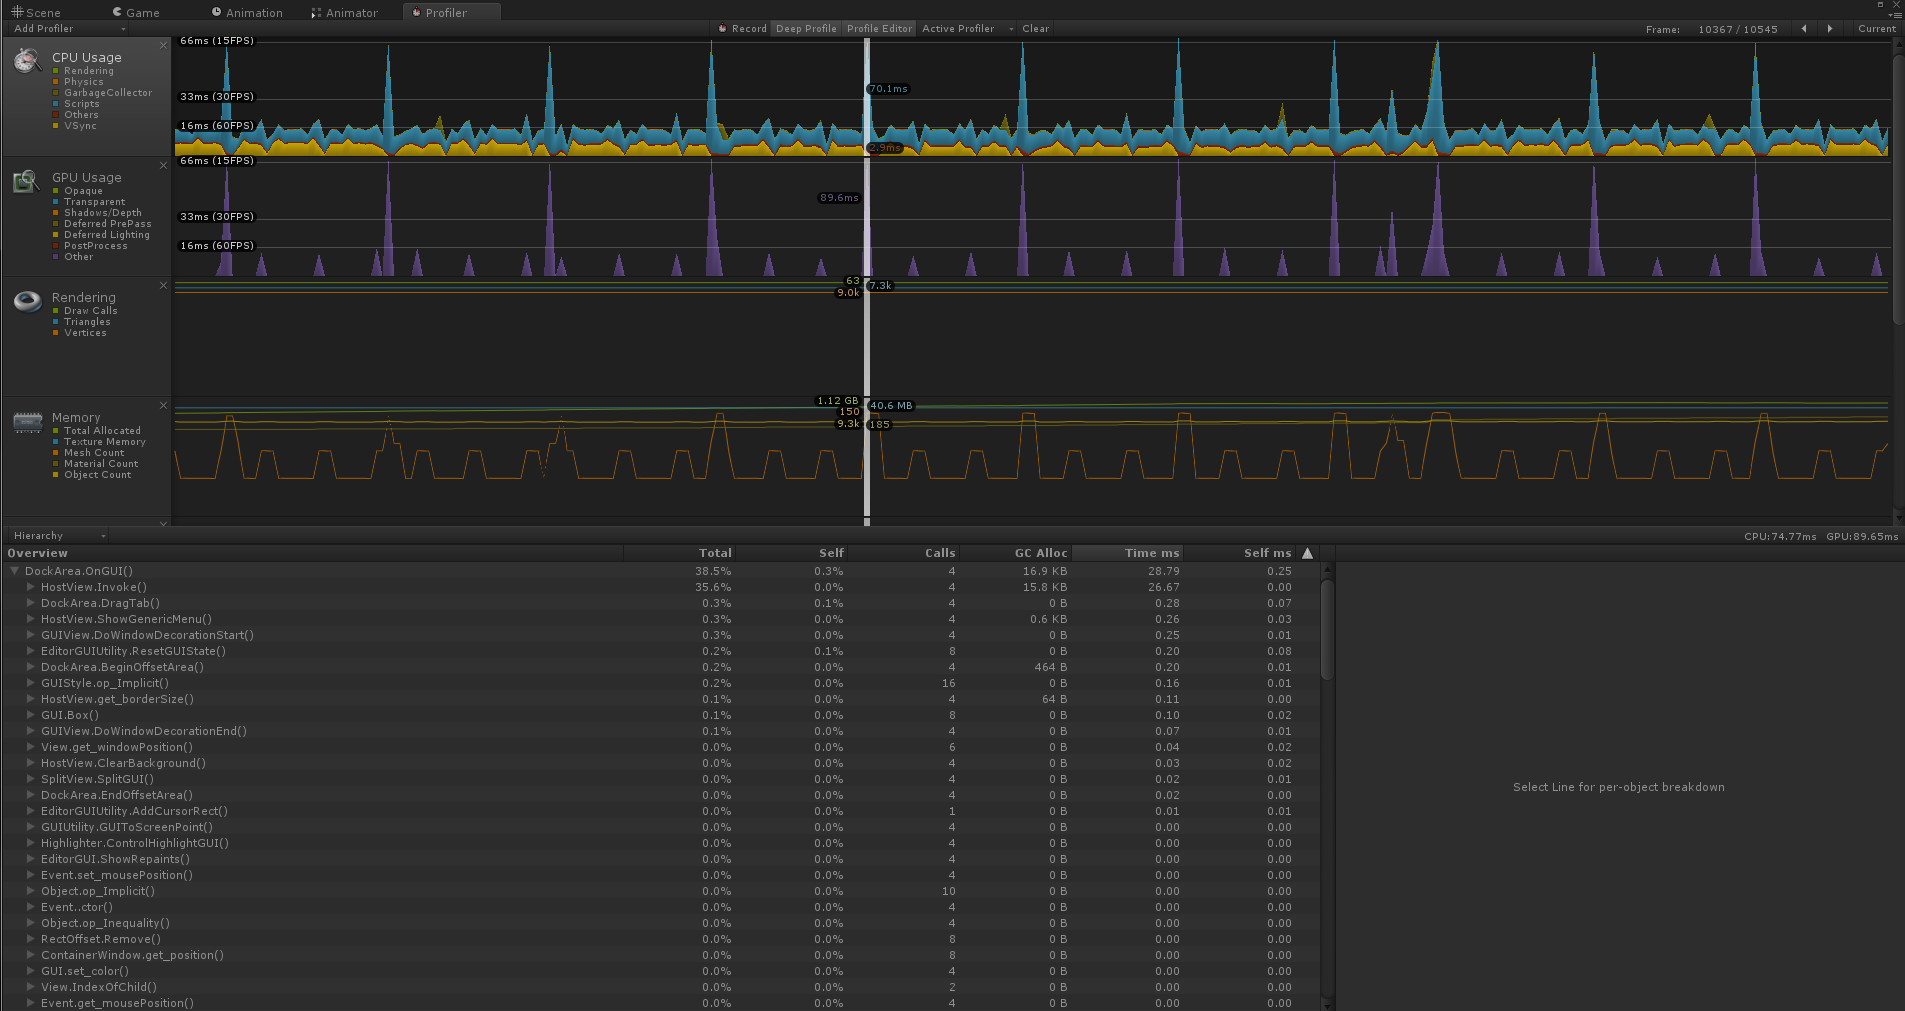
I am having difficulties with performance profiling of my game on android mobile phone, this is graph from android mobile on profiler:

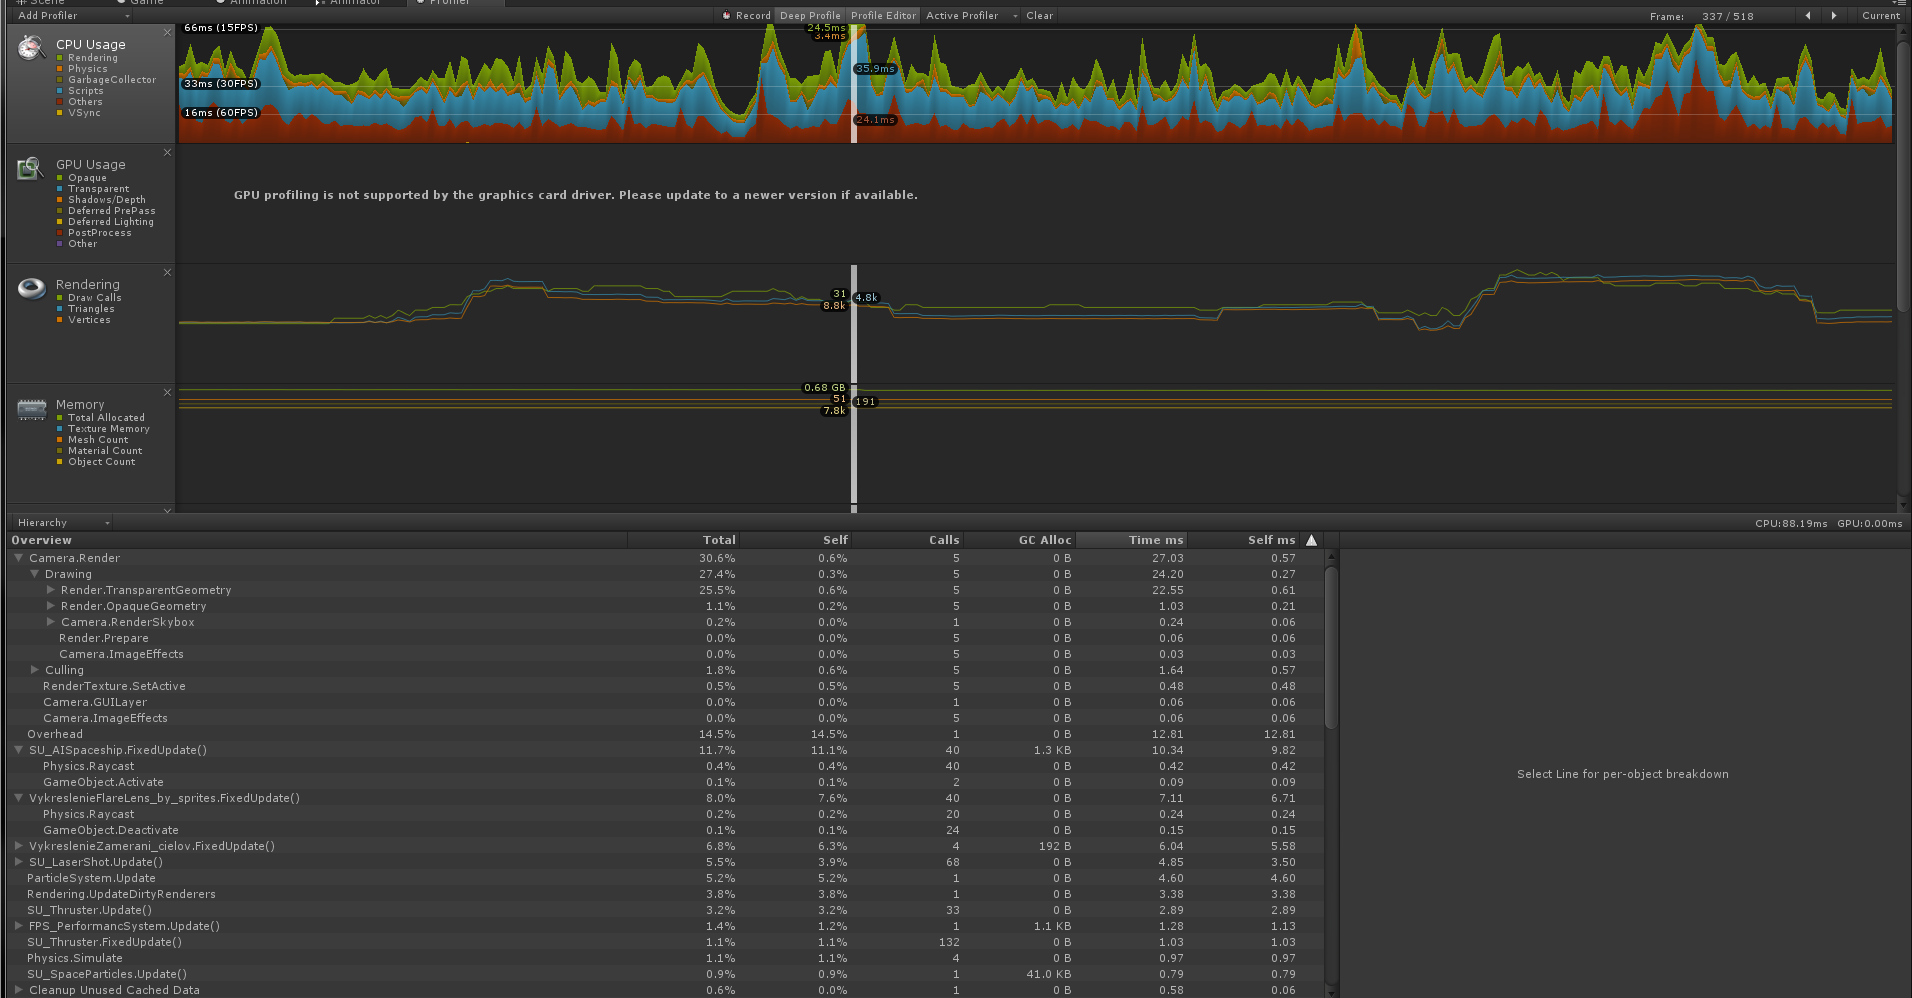
In PC profile the graph is different:

Facts and things and methods I am using:
pooling
particle systems for weapons (and even stretching of particles)
trails (not too many)
low poly models (objects around 500 tris)
skybox and multiple cameras (for gui, for background, for objects)
sprite sheets and sprites to draw few GUI parts on screen, (nothing too advanced)
These graphs are made on very similar situation of game involving 10 AI objects flying on screen and firing on player, the player is doing nothing special and both tests are same in set up
My question is simple, what may be cause of such spike randomness on mobile? (From my observing the spikes are quite random even when there is almost no difference "in game action" on game screen the graph is very fructuated)
Possible guessed issues that may be the main cause:
The spikes are caused by mobile and this kind of frunctuation is normal, yet giga-slow
I made some setting of unity I somehow wrong (or not using something)
There is much more the profiler can/should tell and I cant see it or configure it correctly
Something with overhead (red in graph) or any other color is affecting game globally somehow
Memory leaks, allocation or hidden garbage collecting problems
Something may be wrongly coded, or I do not understand it properly (most of the code is nothing too complex in calculations(as can be seen under graphs there is no one method that takes most of the time),the code consists mostly of many simple positioning, rotating, etc.. (the most complex up to 500lines of code in AI, mostly controled by bool states and if-s, so nothing too special))
I lowered draw calls from 100 to under 50, but that was not the issue. Any Idea, tip or advice would be helpfull, because I run out of options.
Answer by whydoidoit · Mar 24, 2014 at 07:48 AM
Your problem appears to be physics related (by reading the list of things which are taking time in your script).
The way the Physics system works is by running as many times as necessary to catch up with the current real frame, so in some of your frames it is running twice as frequently as in the others. It would appear that each of the calls to your FixedUpdate functions take quite a lot of time and so when this occurs it creates a vicious cycle pushing the frame time much higher.
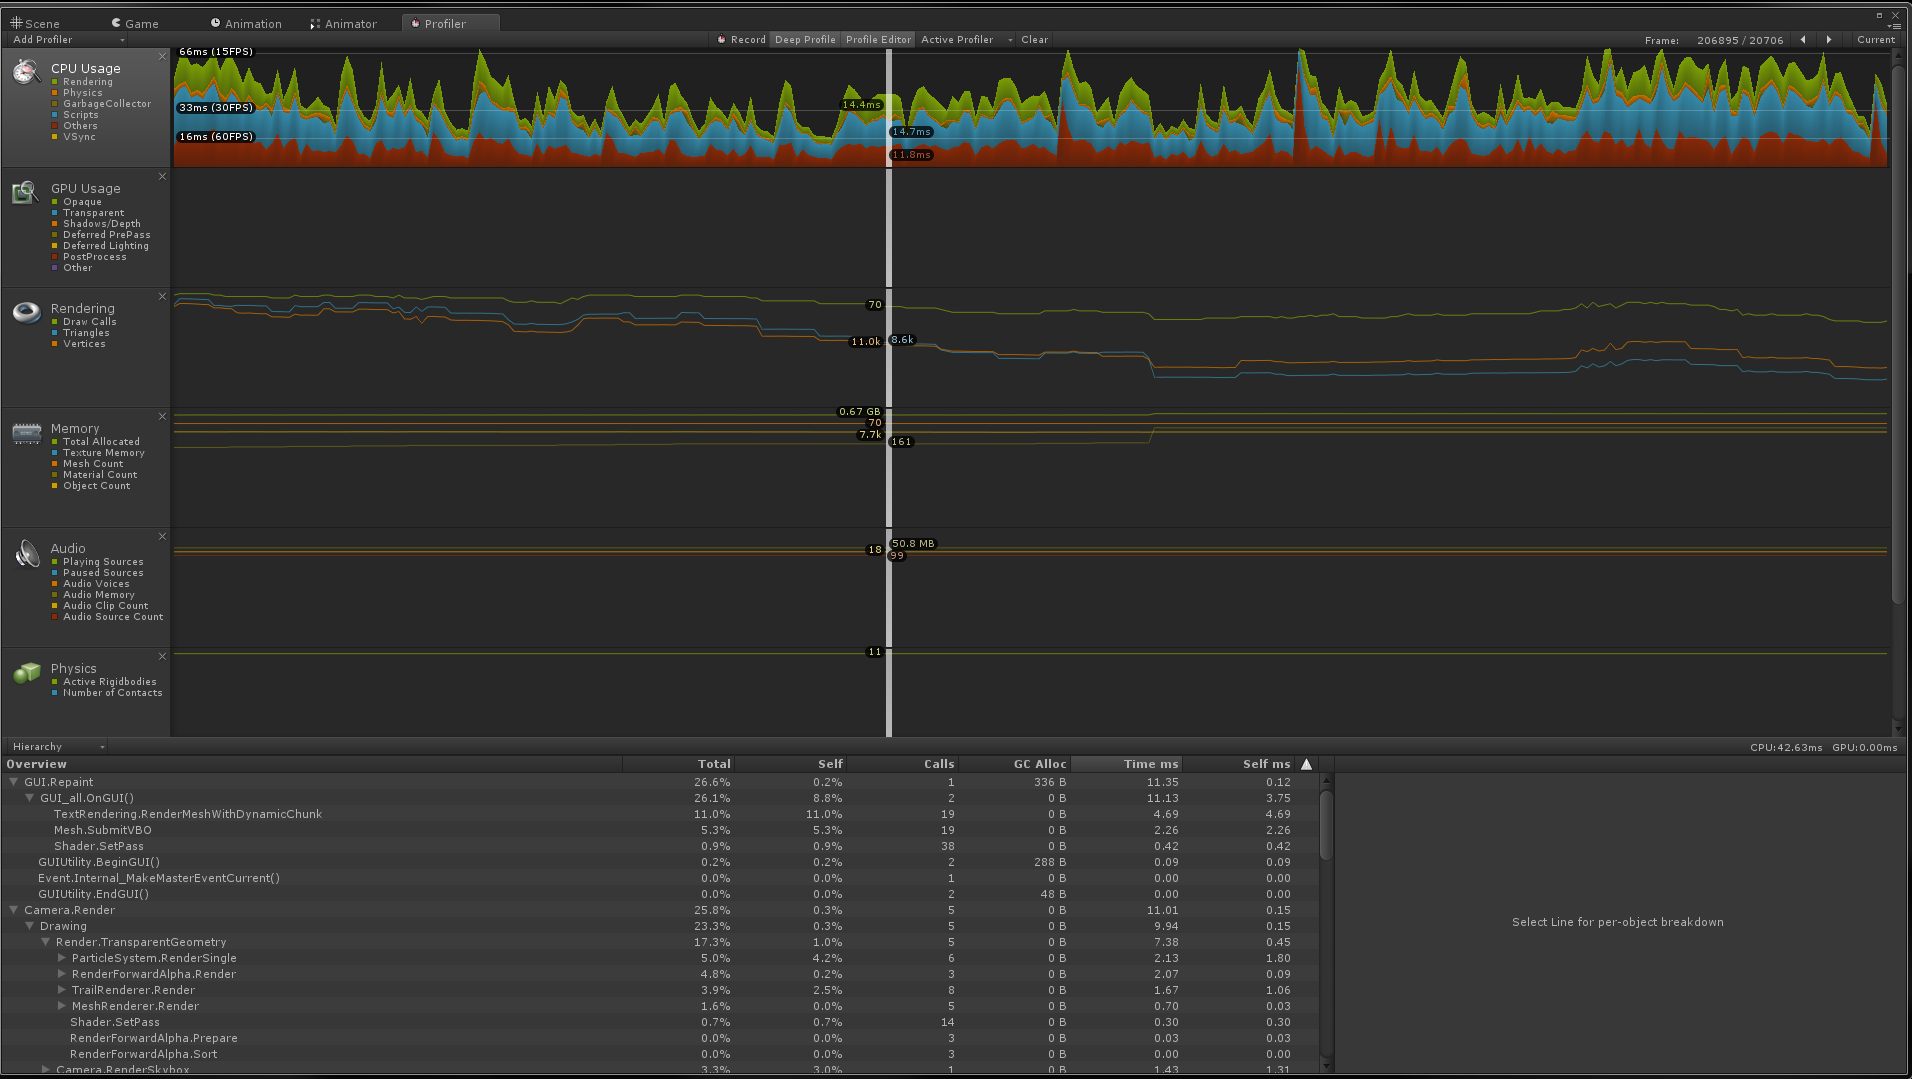
Thank you for great conclusion. But still I am using just as few as 12-14 sphere rigid bodies, another physix usage might be particle systems - weapon shots that have checked collision (to world at low quality, there is not many of them, up to 50). As can be seen on graph of attached picture there is not many collisions going on the scene. I want to understand the problem, is there something more I can check more or look? alt text


It;s not about collisions, it's about simulation. Post your SU_AISpaceship FixedUpdate plus a bunch of the other ones I don't want to try to spell...
Basically when your frame rate drops due to just about anything, physics starts working much harder to keep simulating the world running your FixedUpdate functions more than once per frame. If the fixed updates are slow (as they appear to be) then this exacerbates the frame rate drop because there is even less time to do everything else.
Sure here is one and two of them in the attachment (due to max character limit to answer)
 //VykreslenieFlareLens_by_sprites


 void FixedUpdate () {
         if (fade) {
             alpha_multiplier         -= alpha_fade_decrease_$$anonymous$$us;
             alpha_fade_decrease_perc *= alpha_fade_decrease_perc_increasing;
             alpha_multiplier         *= alpha_fade_decrease_perc;

             alpha_multiplier        = $$anonymous$$athf.$$anonymous$$in($$anonymous$$athf.$$anonymous$$ax(0,alpha_multiplier),1);
         }
         draw();
     }
     private void draw() {
         poc = flareLens_list_used.Count;

         for (i=0; i<poc; i++) {
             flares_parent_object.transform.rotation        = Camera.main.transform.rotation;
             pos = Camera.main.WorldToScreenPoint(transform.position);
             if ((pos.x<0 || pos.y<0 || pos.x>Screen.width || pos.y>Screen.height || Physics.Linecast(Camera.main.transform.position,transform.position)) && !alwaysVisibleToCamera) { // nieje vidiet
                 size_perc-=5f/poc;
                 if (size_perc < 0) {
                     size_perc = 0;
                     flareLens_list_used[i].SetActive(false);
                 }
             } else {
                 flareLens_list_used[i].SetActive(true);
                 size_perc+=5f/poc;
                 if (size_perc > 100) {
                     size_perc = 100;
                 }
             }
             Vector2 rot;
             rot        = new Vector2(Screen.width/2,Screen.height/2) - pos;
             if (horizontal_rotation_enabled[i]) {
                 flareLens_list_used[i].transform.localRotation    = Quaternion.AngleAxis($$anonymous$$athf.Atan2(rot.y,rot.x)*$$anonymous$$athf.Rad2Deg, Vector3.forward);
             } else {
 //                rot = Vector2.zero;
             }
             flareLens_list_used[i].transform.localPosition    = new Vector3(rot.x*vertical_moving_coeficient[i],rot.y*vertical_moving_coeficient[i],flareLens_list_used[i].transform.localPosition.z);
             if (enable_manipulation_with_alpha[i] == false) {
                 float vzd$$anonymous$$ultiplier = 1;
                 if (size_by_vzd_alpha_fading_distance) {//so vzd klesa velkost flary
                     vzd$$anonymous$$ultiplier    = vzd_and_alpha_fading_distance/$$anonymous$$athf.$$anonymous$$ax(Vector3.Distance(Camera.main.transform.position,transform.position),vzd_and_alpha_fading_distance);
                     vzd$$anonymous$$ultiplier    = $$anonymous$$athf.$$anonymous$$ax(1,vzd$$anonymous$$ultiplier*2); //svetlo klesa s vzd rychlo od polky uvedenej vzd
                 }
                 flareLens_list_used[i].transform.localScale        = sizes[i]*vzd$$anonymous$$ultiplier*size_perc/100;
             } else {
                 color    = flareLens_list_used[i].renderer.material.GetColor("_TintColor");
                 float vzdNeco = $$anonymous$$athf.$$anonymous$$ax(0,0.75f - rot.magnitude/($$anonymous$$athf.$$anonymous$$ax($$anonymous$$athf.Abs(rot.normalized.x*2),$$anonymous$$athf.Abs(rot.normalized.y/*/2*/))*Screen.height/2));
                 if (alwaysVisibleToCamera) {
                     vzdNeco = 1;
                 }
                 color.a = vzdNeco * vzd_and_alpha_fading_distance/$$anonymous$$athf.$$anonymous$$ax(Vector3.Distance(Camera.main.transform.position,transform.position),vzd_and_alpha_fading_distance)*alpha_multiplier;
 //                print ($$anonymous$$athf.$$anonymous$$ax(0,0.75f - rot.magnitude/($$anonymous$$athf.$$anonymous$$ax($$anonymous$$athf.Abs(rot.normalized.x*2),$$anonymous$$athf.Abs(rot.normalized.y/*/2*/))*Screen.height/2)));
                 flareLens_list_used[i].renderer.material.SetColor ("_TintColor", color);
             }
         }
     }
     public void fadeAway() {
         //warning toto musi byt ulozene niekde v defaulte a tiez buduci pooling
         fade = true;
     }
Any idea what might be causing such "weird" spikes on android, please? Anything will help, even unprobable things.
Your answer

Follow this Question
Related Questions
Profiler problem analysis Unaccounted time between: UGUI.Rendering.RenderOverlays and GUI.Repaint 0 Answers
Total memory allocated increases indefinately from .80GB untill crash 3 Answers
Improving custom shader performance? 0 Answers
Unaccounted time between: Start of Frame and Camera.FindStacks 1 Answer
iOS Profiler: What to look for 0 Answers
