Low FPS on Simple geometry?
Hello, I'm getting 20-45 FPS on a fairly simple scene made with very simple geometry with Standard Shader and some HDR Emissions (nothing mad, just some glowing ornaments).
I am getting 20-45 FPS with no apparent cause. The Profiler shows that only Camera Render (Drawing) takes 3 - 4 ms, and the statistics are on the picture below: 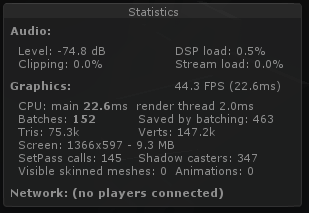
What can be the cause? There are no textures (just plain albedo) and no reflection probes. I expected this thing to run at least 60 fps no problem. Is there something wierd going on in Statistics?
I want to use Realtime Global Illumination and am seriously concerned about how will it work with this FPS.
PS: My specs are laptop-typical. Nothing bad, nothing ultra.
Bro lower your shadow casters ... try to bake lighting information
Just in case you haven't seen it yet, Unity has a built-in profiler (Window --> Profiler). The most common mistakes are:
Having Debug.Logs / print statements execute every frame. Debug logs are extremely slow in the editor.
Depending on the hardware Unity's "Standard Shader" might be too heavy for your PC. Try a simple diffuse shader
Unity's procedural skybox can also have an effect on performance.
Maybe you move objects that are marked as static. Never do that, ever. If you might move an object, don't mark it as static. Also avoid moving colliders without a rigidbody.
Btw: I'm not sure where's the "simple" in this case. 147k vertices and 75k tris isn't that simple given you have 145 set pass calls. Try to cut down the number of materials.
We don't know anything about your scene so we can't suggest anything. How many moving objects, how many static objects? Are static objects marked as static?
Hello and thank you for the answers!
First, the profiler shows not much, as mentioned in the opening post. Just the camera's drawing for 3-4 ms and nothing else.
Debug is clean - I'm using it very sparingly and for this test I turned them off completely.
About he diffuse shader - I will try it, but will it be compatibile with Emissiveness for Realtime Global Illu$$anonymous$$ation?
I will try the skybox sollution tomorrow, as soon as I get back to comptuter. :)
How do I turn down the Set Pass Calls? All the scene runs on 5-6 different materials and that's it.
The scene is a hall with collumns, all made with ~3x3 cubes. Everything is set as static and never moved, no animations or scripts or rigidbodies. For now there's only a single standard FPS Controller for player and honestly - nothing more. There's one Directional light with shadows on - turning it off (so the shadow casters are 0), makes it a "more stable" 35 fps.
IF you only use 5-6 different material you wouldn't have that many set pass calls. Do you modify any material properties via script? Accessing "renderer.material" will duplicate the material. Also changing any material properties on an instance will also duplicate the material.
The profiler doesn't show anything? I can't believe that ^^. You seem to be CPU bound, so it's something that eats most of your frame time. $$anonymous$$eep in $$anonymous$$d that you can switch the profiler into "deep" mode where it shows the usage of every script method call as well.
Such questions are hard to answer since we know nearly nothing about your scene / setup.
Alright, following the advice, I am adding the Profiler for Rendering and CPU. $$anonymous$$aybe it will give some more insight into what's going on. 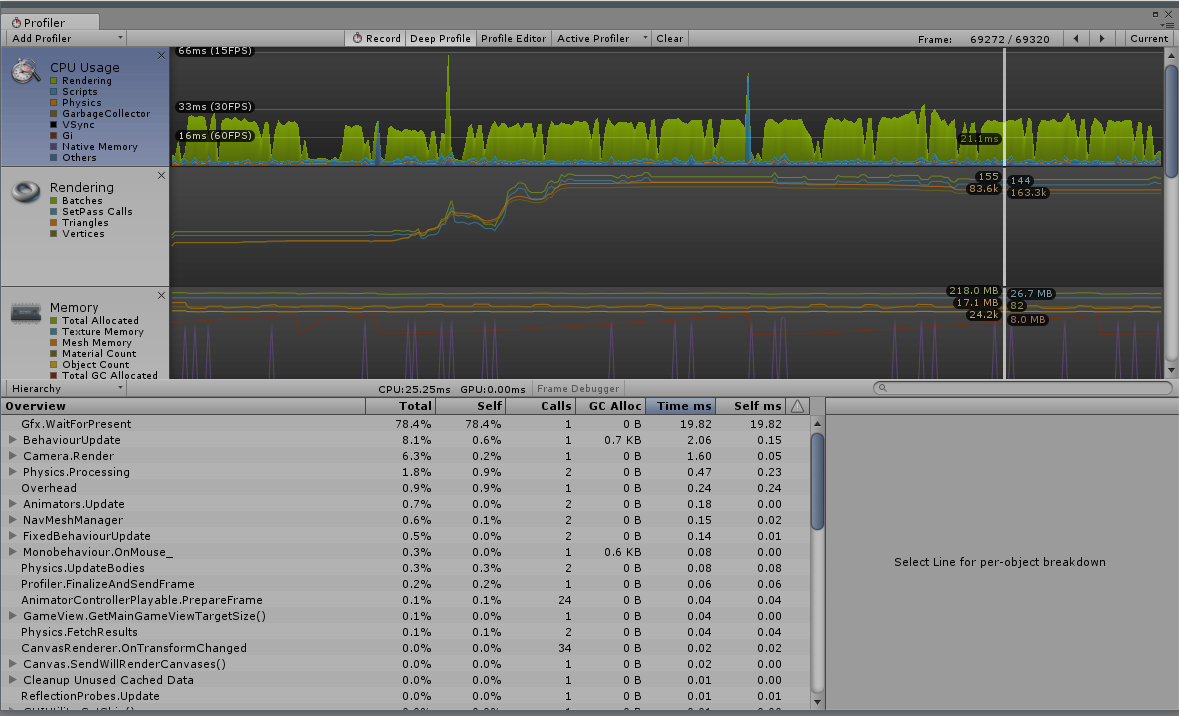
"WaitForPresent" is vsync -- it's waiting to reach a target framerate. Check your Application.targetFrameRate.
Yeah this actually looks like 30FPS is your target framerate. If you're setting Application.targetFrameRate to 30 in your code, then don't. If not then look at your quality settings and change vsync to "don't vsync" or "every v blank" and make sure it is not set to "every other v blank"
Another thing you could try is occlusion culling.
It gives a 4-5 more FPS. Not much, but still it helps. Thank you :)
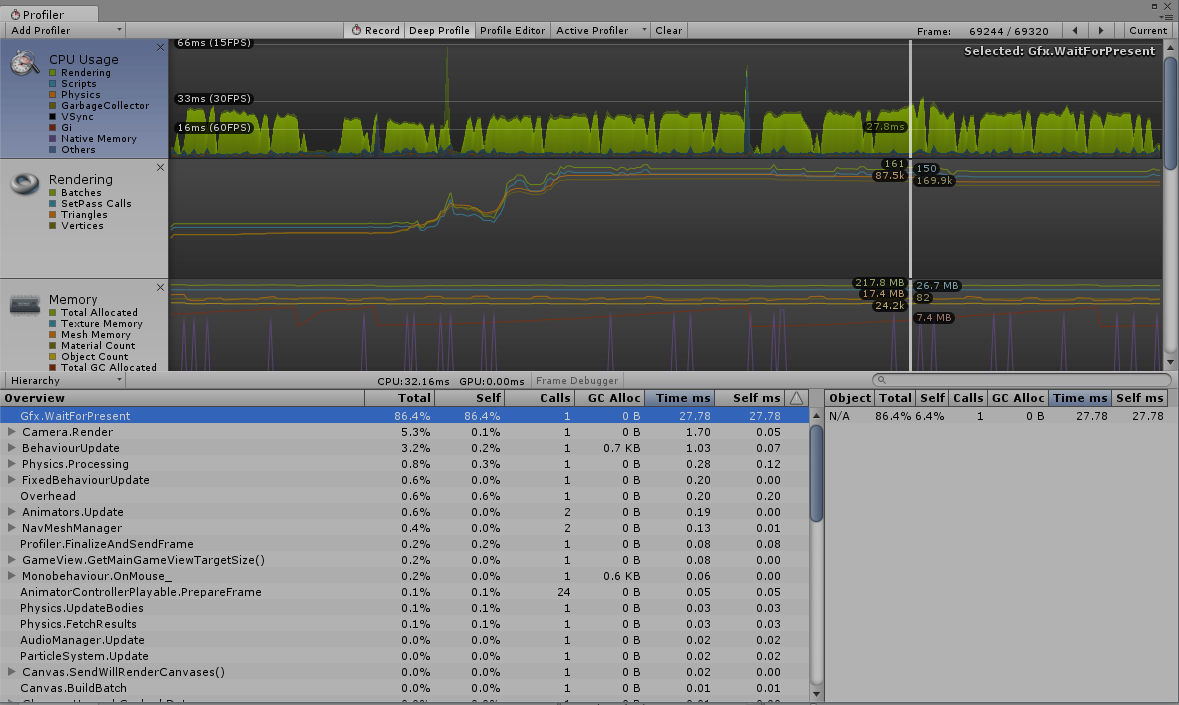
Gfx.WaitForPresent is the result of vertical sync right? Try to disable that.
V-Synch is turned completely off. Is there anything to get rid of GFX Waitforpresent?
WaitForPresent isn't anything to be concerned with, it is just empty space waiting for the target framerate. WaitForPresent will reduce to nothing when your rendering pipeline needs those frames. So for some reason you're locking to 30FPS even though you say vsync is off. $$anonymous$$aybe you have a really horrible GPU that caps at 30FPS?
Run the profiler 22ms on the CPU thread sounds like some real slow code somewhere. I've got 1,000s of real-time lit objects all being moved every frame and at peak we have 30ms on the main thread (yeah it sucks). So check the profiler, look at the report of what scripts are eating up all your time.
