Physics2D performance spikes in profiler
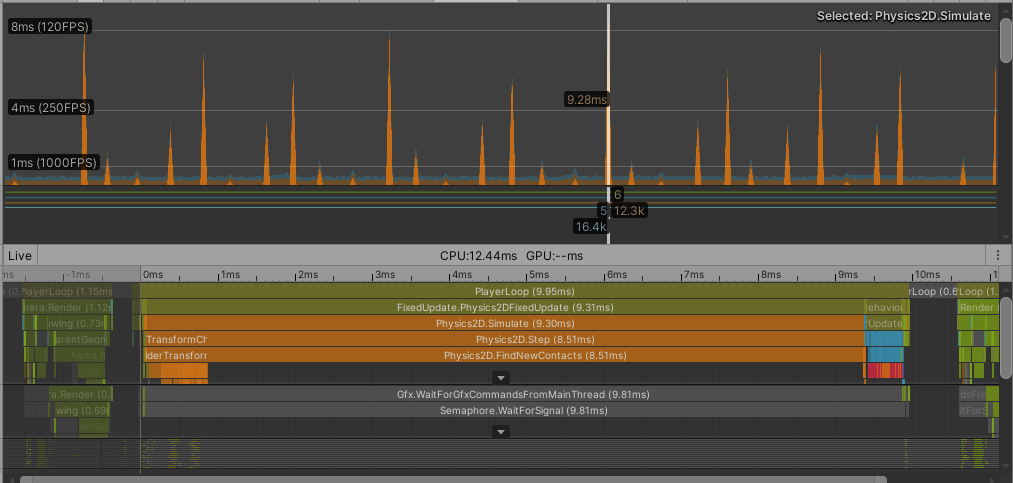
Hi, I am working on a game where you are working on an idle ants colony. From the beginning I noticed that my FPS goes from 1500 to around 300 in couple of seconds (it stays stable later but 300 is still really low for what I have in my project currently). So, I opened the profiler and noticed that Physics2D is causing really huge spikes:
So, quick description of my project setup:
have about 50 ants on the screen and their logic is really cheap (blue region in the profiler). That's their only component (beside SpriteRenderer), but I am using a Physics2D.OverlapCircleAll 3 times each frame for each ant (each overlap circle acting like a sense for pheromones)
Pheromones only have Circle Collider 2D on them, but I have around 10k of them (not on the screen all the time). I have a pool managing pheromone lifetime and moving the pheromone off and on screen when required. I am moving a lot of pheromones on and off screen at runtime since an ant is placing a new pheromone after 0.5 secs and the old ones are moved offscreen. I guess this has something to do with the spikes but since I am not using Rigidbodies at all, I am kinda wondering why and if this is actually the case.
Also, I have set up the physics options correctly (layers etc), and also using FixedUpdate doesn't help, it gets even worse in that case.
I would really like to hear any opinion on this.
Thanks!
