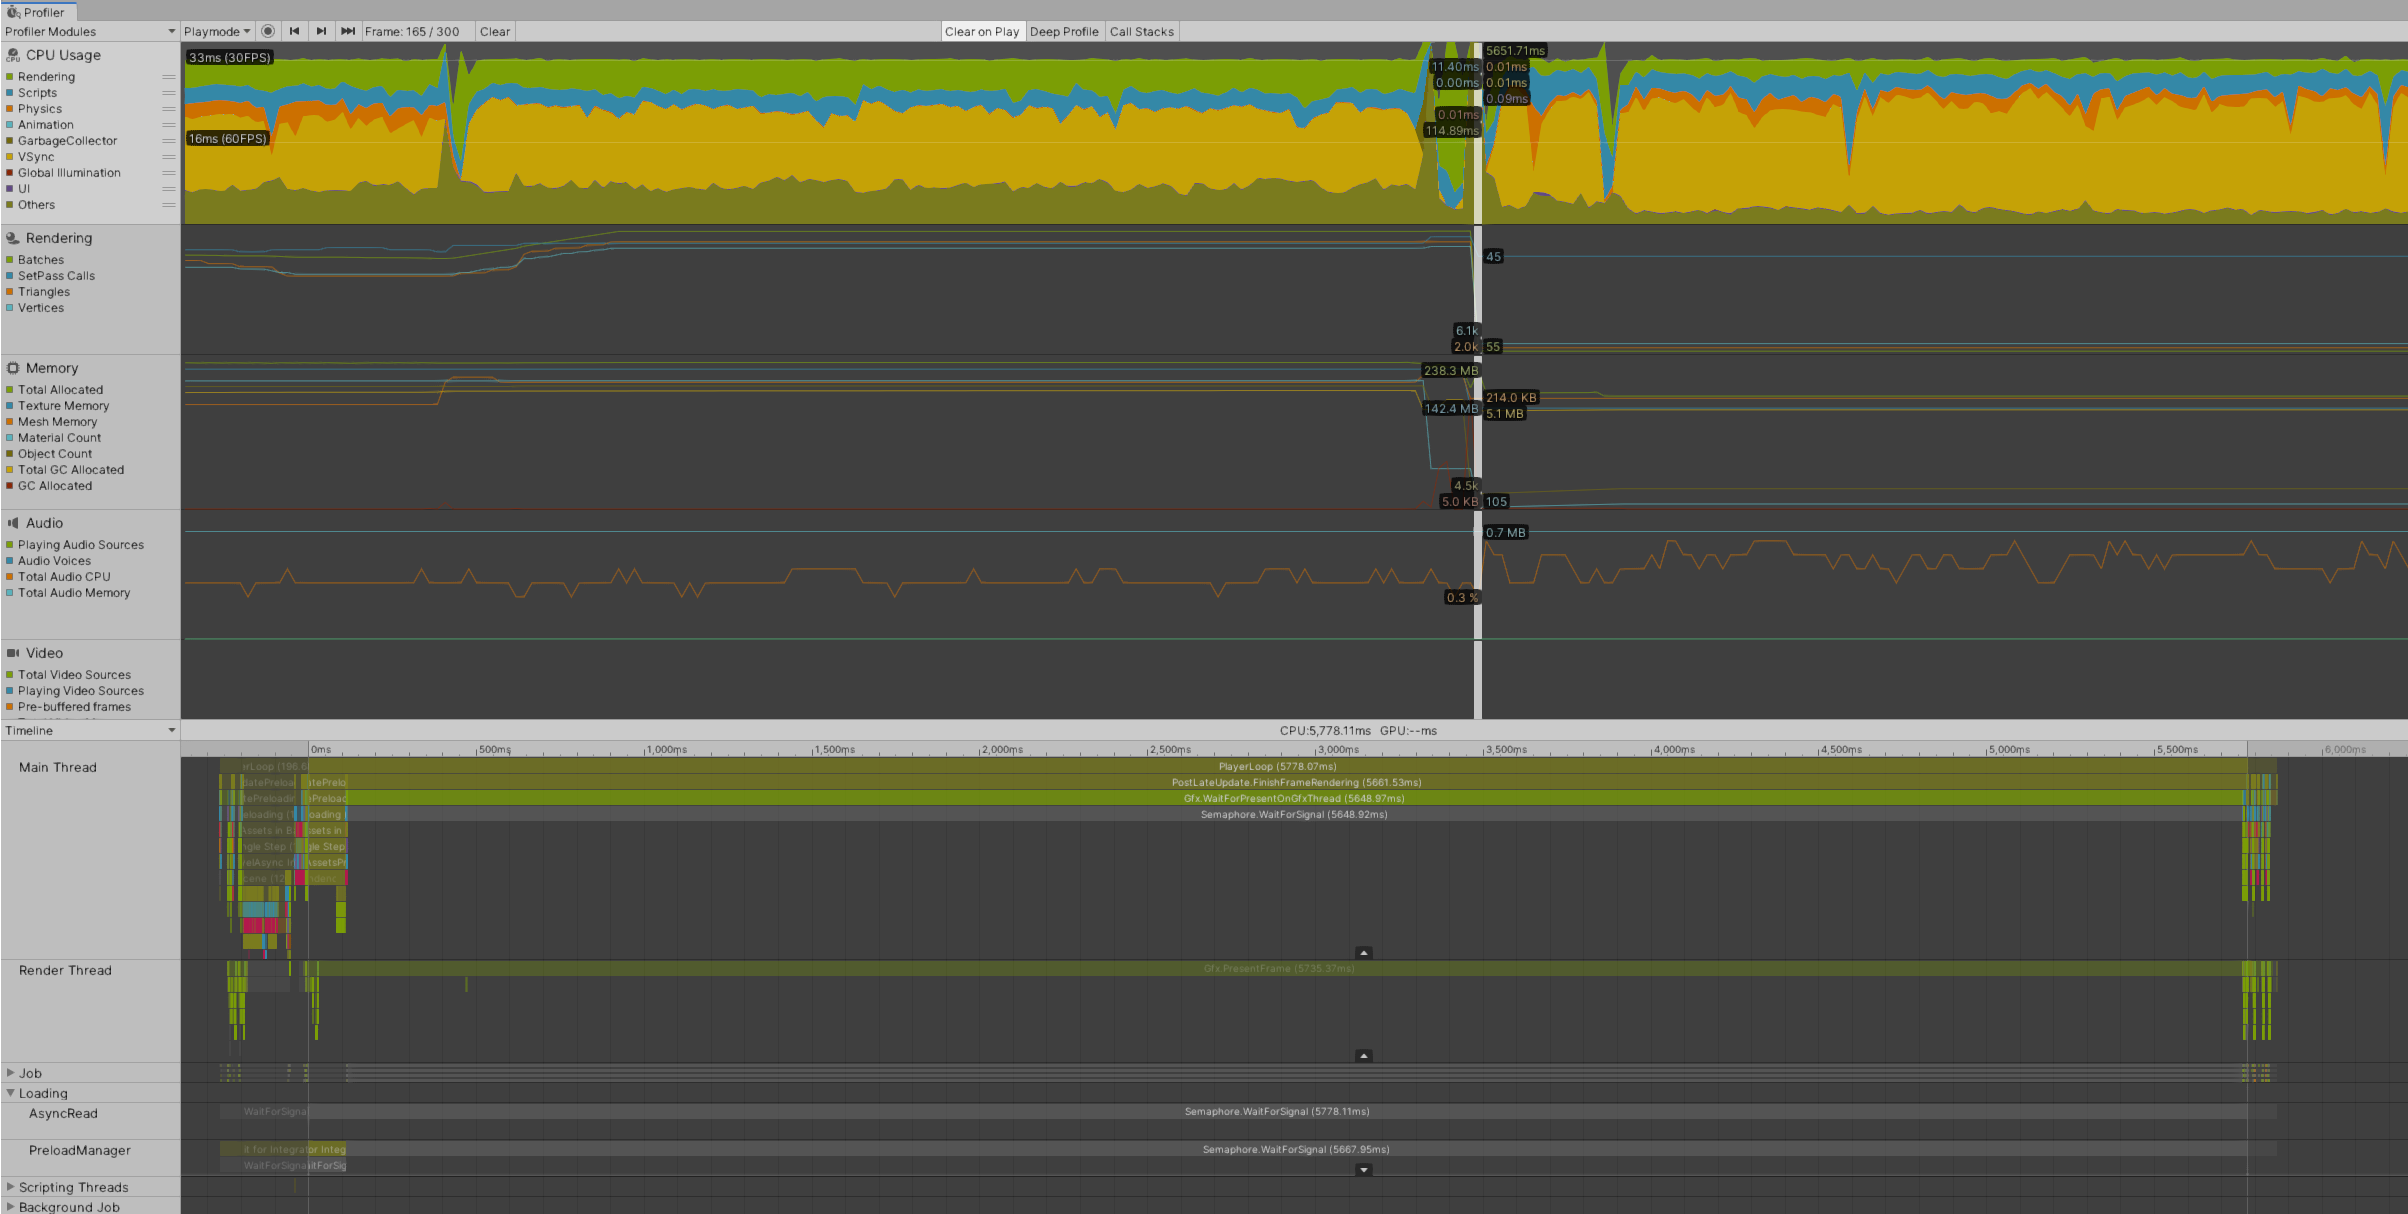
Massive Rendering spike in profiler when unloading the scene
Hello,
I'm having this strange issue that happens every time I unload my main game scene and load the main menu scene.
I'm running my game on Android and when I load the main menu scene from the game scene the game freezes for a few seconds. Depending on how long the game scene was running, the freeze time is higher.
On the editor and PC build everything works just fine. I have turned off VSync but of course, that would not make much difference on Mobile devices.
All clues lead me to believe that the issue was memory management and GC but when I used the profiler to investigate the problem I realized it's, in fact, the rendering that stalls the CPU for more than 5 seconds.

As you can see the source seems to be on the rendering thread and the task is Gfx.PresentFrame which is taking a whopping 5.7 seconds.
Some context on what is happening on the game scene and what is happening on the main menu scene.
both scenes have post-processing and bloom
the game scene has about 1000 geometrical objects (cubes, spheres, etc. nothing complex)
the main menu scene has a bunch of UI elements and at the startup checks for user credentials with some API calls to the server.
the main menu scene has a constantly rotating object in it (just put it here to point that there are tasks for CPU not to stay idle)
I believe the source of the problem is in the game scene which is being unloaded since I made a test scenario and loaded an empty scene instead of the main menu and the same freeze behavior was present
The fact that it only happens when I load back into the main menu and the game freezes for some time is confusing me since everything looks like a memory issue but the profiler is saying otherwise. I am using LoadSceneAsync and UnloadSceneAsync for my scene transitions.
Based on what I provided here, can someone please point me in the right direction on how to fix this issue?
Thanks in advance.
Your answer

