Why is StackTraceUtility.ExtractStringFromExceptionInternal generating so much garbage collection?
So I have searched for this particular problem but haven't found much about it, only that it might have to do with printing to console, I've removed all uses of Debug.log in my game but it didn't work, every frame this is taking 50+- ms, don't know what to look for. I'm profiling on an android phone which is my target platform 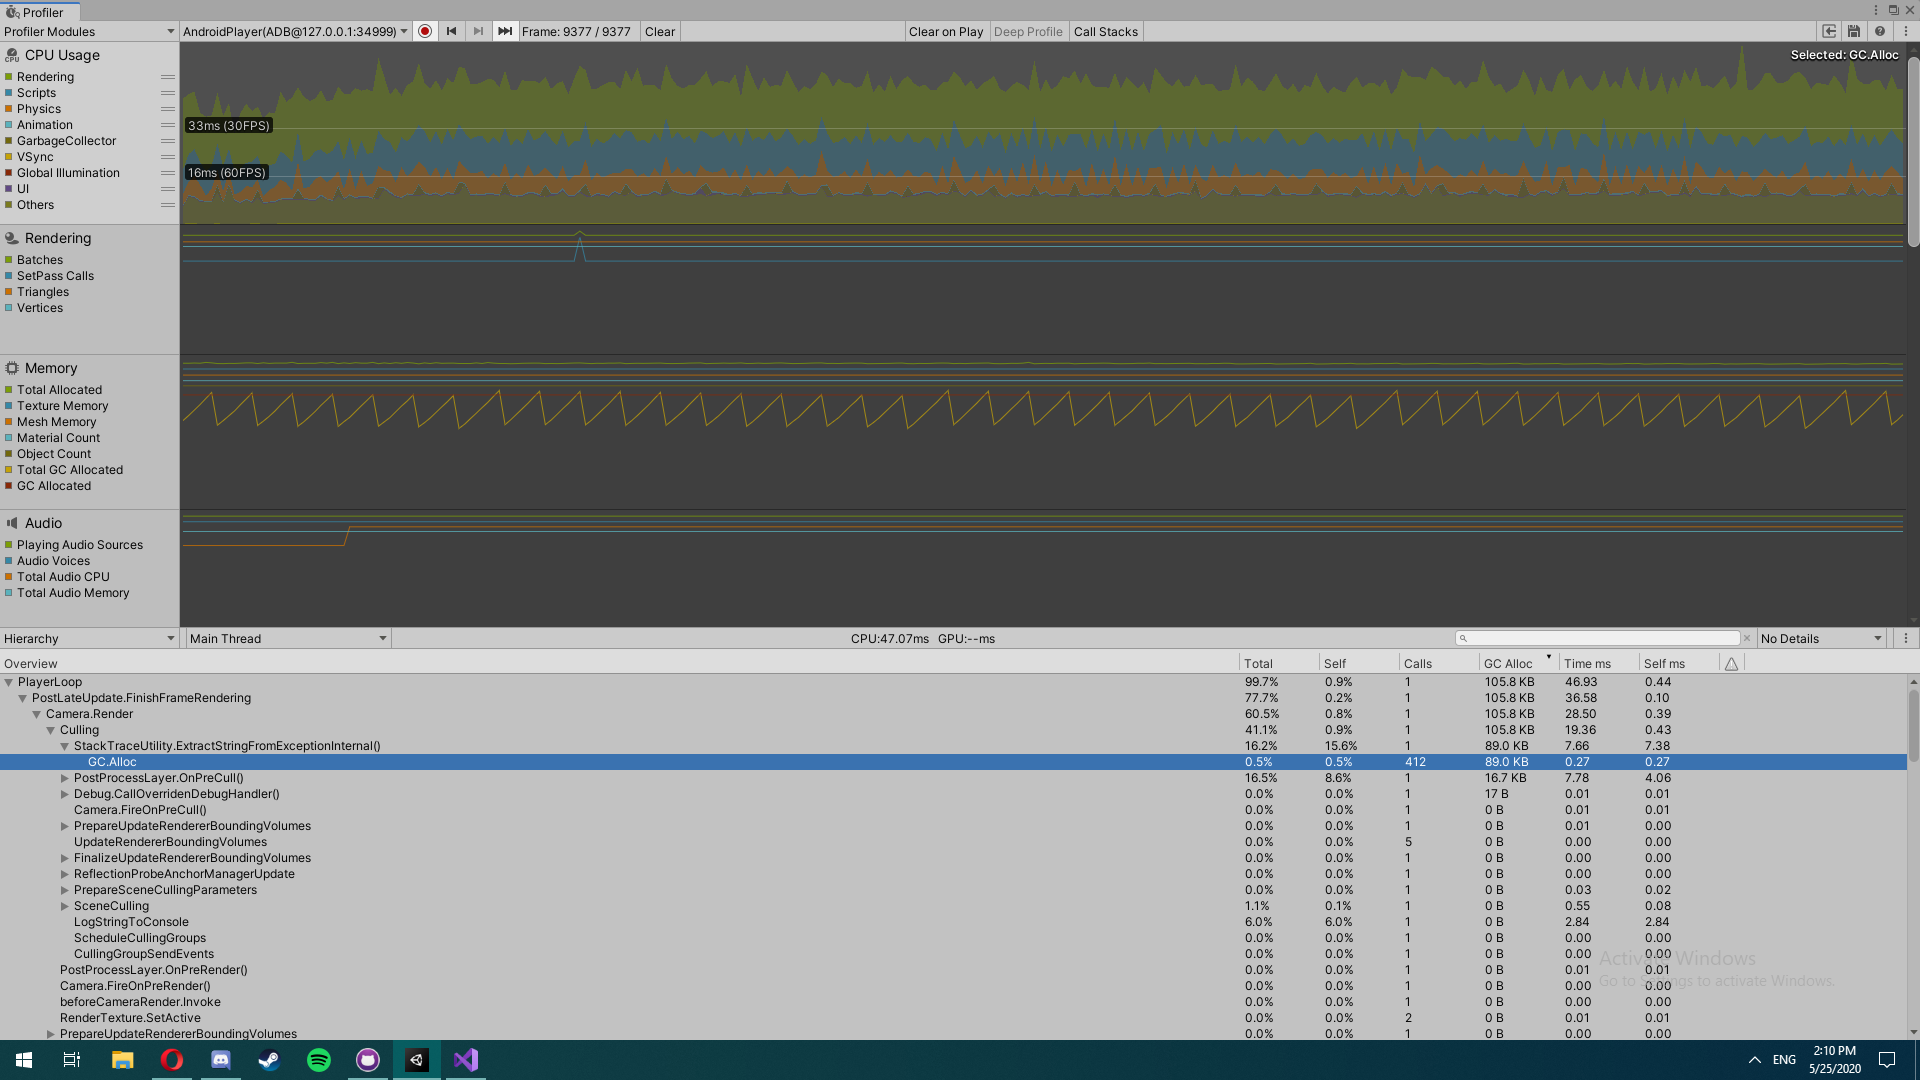
