Extremely poor Android performance, even in simple scenes
I'm seeing extremely low framerates when testing my game on Android and I haven't been able to figure out the cause. When testing on a low-end PC (integrated graphics, low-end CPU) I get fairly decent performance but testing on a Nexus 7 tablet my FPS is in the single digits.
The main thing that I notice is that performance is poor even on the main menu of the game, which has no 3D graphics whatsoever - this makes me think that there could be something causing really poor performance aside from unoptimized textures, draw calls, shaders and so on.
Since a question like this is pretty much worthless without more details, here's what I've established so far:
Using Unity 2018.3.6f1 and building to a Nexus 7, I get about 14 FPS in the main menu. This is using the following setup:
Deferred rendering
Vsync turned off
OpenGLES3 used
Textures compressed using ETC2 32-bit
Switching to forward rendering, the framerate increases somewhat (to around 24). Forcing OpenGLES2 also increases the framerate by this amount, presumably because it forces forward rendering as well.
In the profiler I see the following:
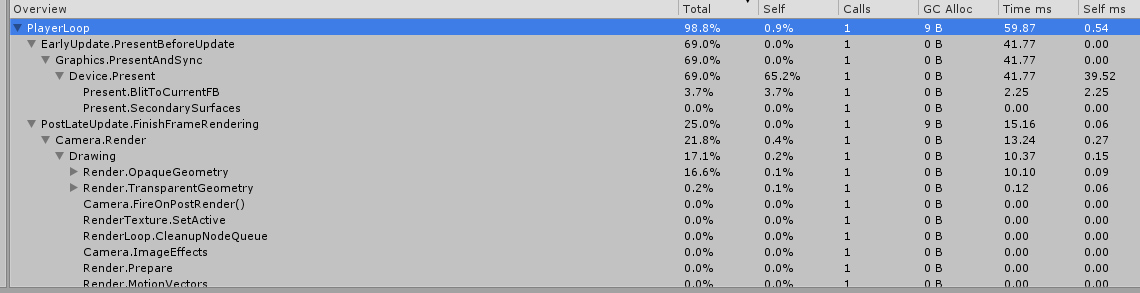
It doesn't seem as specific or verbose as I'd like and I'm having a hard time parsing what's actually going on there.
Once loaded in the actual game, my framerate drops to about 5 (deferred) or less than 1 (forward). Worth noting is that I only have a single realtime directional light in the scene - all other lights are set to baked only. The profiler now looks like this:

Note that what appears to be an image effect is actually a camera render to a render texture - to save performance and to give the game a pixelated look, I have a camera that renders the scene in a low resolution to a render texture which then gets upscaled to fit the screen. While I initially thought this may be the cause of the performance issues, switching to a single conventional camera with no render textures or image effects does not seem to improve performance at all.
In addition - not sure if related or not - I'm seeing an odd visual glitch where the screen keeps slightly flickering to black. At first I thought this too was related to the render texture but it does the same in the main menu which doesn't use that at all, so not sure what that could be. Every second or so the screen gets slightly darker (not completely black) and then every other second it's back to normal.
Does anyone have some starting points to offer for how I would look further into what may cause these extreme framerate drops? While I definitely do have some work to do in terms of optimizing materials and textures, the fact that it's so bad even in a UI-only scene makes it seem like there's more going on.
Not sure if I left out something critical so feel free to ask for any further details. Thanks!
In case it's relevant, here's the 'Downsample' class I have that renders the (inactive) player camera to a rendertexture that a second camera with an active Camera component:
 void OnRenderImage(RenderTexture source, RenderTexture destination)
     {
         if (gameObject.activeSelf)
         {
             for (int i = 0; i < renderSourceCameras.Length; i++)
             {
                 renderSourceCameras[i].targetTexture = downsampleRenderTexture;
                 renderSourceCameras[i].Render();
                 renderSourceCameras[i].targetTexture.DiscardContents();
                 renderSourceCameras[i].targetTexture = null;
             }

             Graphics.Blit(downsampleRenderTexture, destination);
         }

     }

    void OnPostRender()
     {
         if(downsampleRenderTexture != null)
         {
             downsampleRenderTexture.DiscardContents();
         }
     }
Some further notes - through more aggressive optimization in many different areas the situation improves somewhat and I'm getting between 20 and 6 FPS depending on the direction I look (I do make use of occlusion culling but it's probably not as efficient as it could be).
I'm currently averaging around 200-400 draw calls, which may be quite a bit on the high end so perhaps taking some time to ensure more efficient batching would help.
There's also the matter of canvases - it seems like UI canvases are very poor on performance and I make quite heavy use of these for my UIs. However, disabling all UI altogether doesn't provide that much of a performance boost so I doubt it would be the only culprit.
As for the Device.Present line, maybe you've found this already, but check here: https://forum.unity.com/threads/device-present-in-profiler-what-the-deal.86312/
There's a "VBL" option that could force VSync even if you disable it, and someone said disabling it fixed a performance issue.
As for the render to texture and downsampling stuff... Why are you doing all that setting, removing and discarding rendertextures all frames? Can't you create a render texture once with the expected resolution, set it once as the target of the camera, and just blit the texture each frame?
I hadn't actually considered that for the downsample function but indeed this works just as well - https://pastebin.com/fXwxw4qr - thanks for the suggestion.
I did see the thread you linked but so far I've been unable to actually find that setting within Unity - maybe newer versions removed it? Or maybe I just have a hard time finding it...
Yes, didn't saw the date of those posts, it looks like "Sync to VBL" was replaced later with "VSync count".
$$anonymous$$aybe you can try disabling some stuff to see if some object in you game makes a big difference. Also, have you tried in other phones and models? Just to discard hardware issues.
