How do I optimize my game when I've tried everything and still runs slow?
Hello,
so my little game for android is pretty much done, the problem is that when I run it on my phone to test it out it doesn't run 100% fluid. It's not critical but still bothers me. I've tried to fix this in so many ways i don't even know what else to try. The thing is, in the game you move forward in a straight path and you can move left and right to avoid objects. Similar to a temple run, yes. But the game only runs slow when the player is on the middle lanes. It runs perfectly when it is on the outer lanes. I've reduced garbage collection by almost 90%, tried lighting on and off (there is actually only one directional baked light and it doesn't even cast shadows), removed objects, added occlusion culling so that there are not unneccessary obects to render, reduced the far clipping plane of the camera at less than half, optimized the code as much as possible. And it still runs slow.
Does anyone have any idea of what could this be? How else could I fix it?
I've also tried ETC texture compression which I've read is perfect for android but doesn't make any change. The game is composed by cubes with no texture, only standard colours and there are a maximum of 120 objects in each level, and not all of them are rendered now, so it's not that much.
Could it be my phone? It's a Samsung a5.
Thanks so much, waiting for anyone's response since i've ran out of ideas.
Answer by chillersanim · Oct 06, 2016 at 09:14 AM
Have you already profiled your game?
If not, make a build with autoconnect to profiler.
Do a deep profiling run and then check what is slowing down your game.
Might be of help:
http://answers.unity3d.com/questions/32368/how-do-i-profile-on-an-android-device.html
Greetings Chillersanim
I have profiled it in the editor with the profiler window, used it to reduce the garbage col.
I just tried the autoconnect profiler build but I don't understand how it works because i don't see any change in the game on my android or I don't know how to see the stats the autoconnected profiler is supposed to display. First time trying this build option so I'm pretty lost haha What's the purpose of that? I didnt understant much the post you sent me to, sorry. I'm pretty new to this.
The autoconnect profiler option makes the game try to connect to your unity instance so that you can profile the app.
This would allow you to find CPU spikes, bottlenecks etc. which only appear on your android device.
If you enable that option, Unity with the project needs to be running and the android device needs to be connected.
Don't know whether there are other requirements as well.
As soon as the game starts, it will try to connect, and if sucessfull, the profiler will automaticly start showing data.
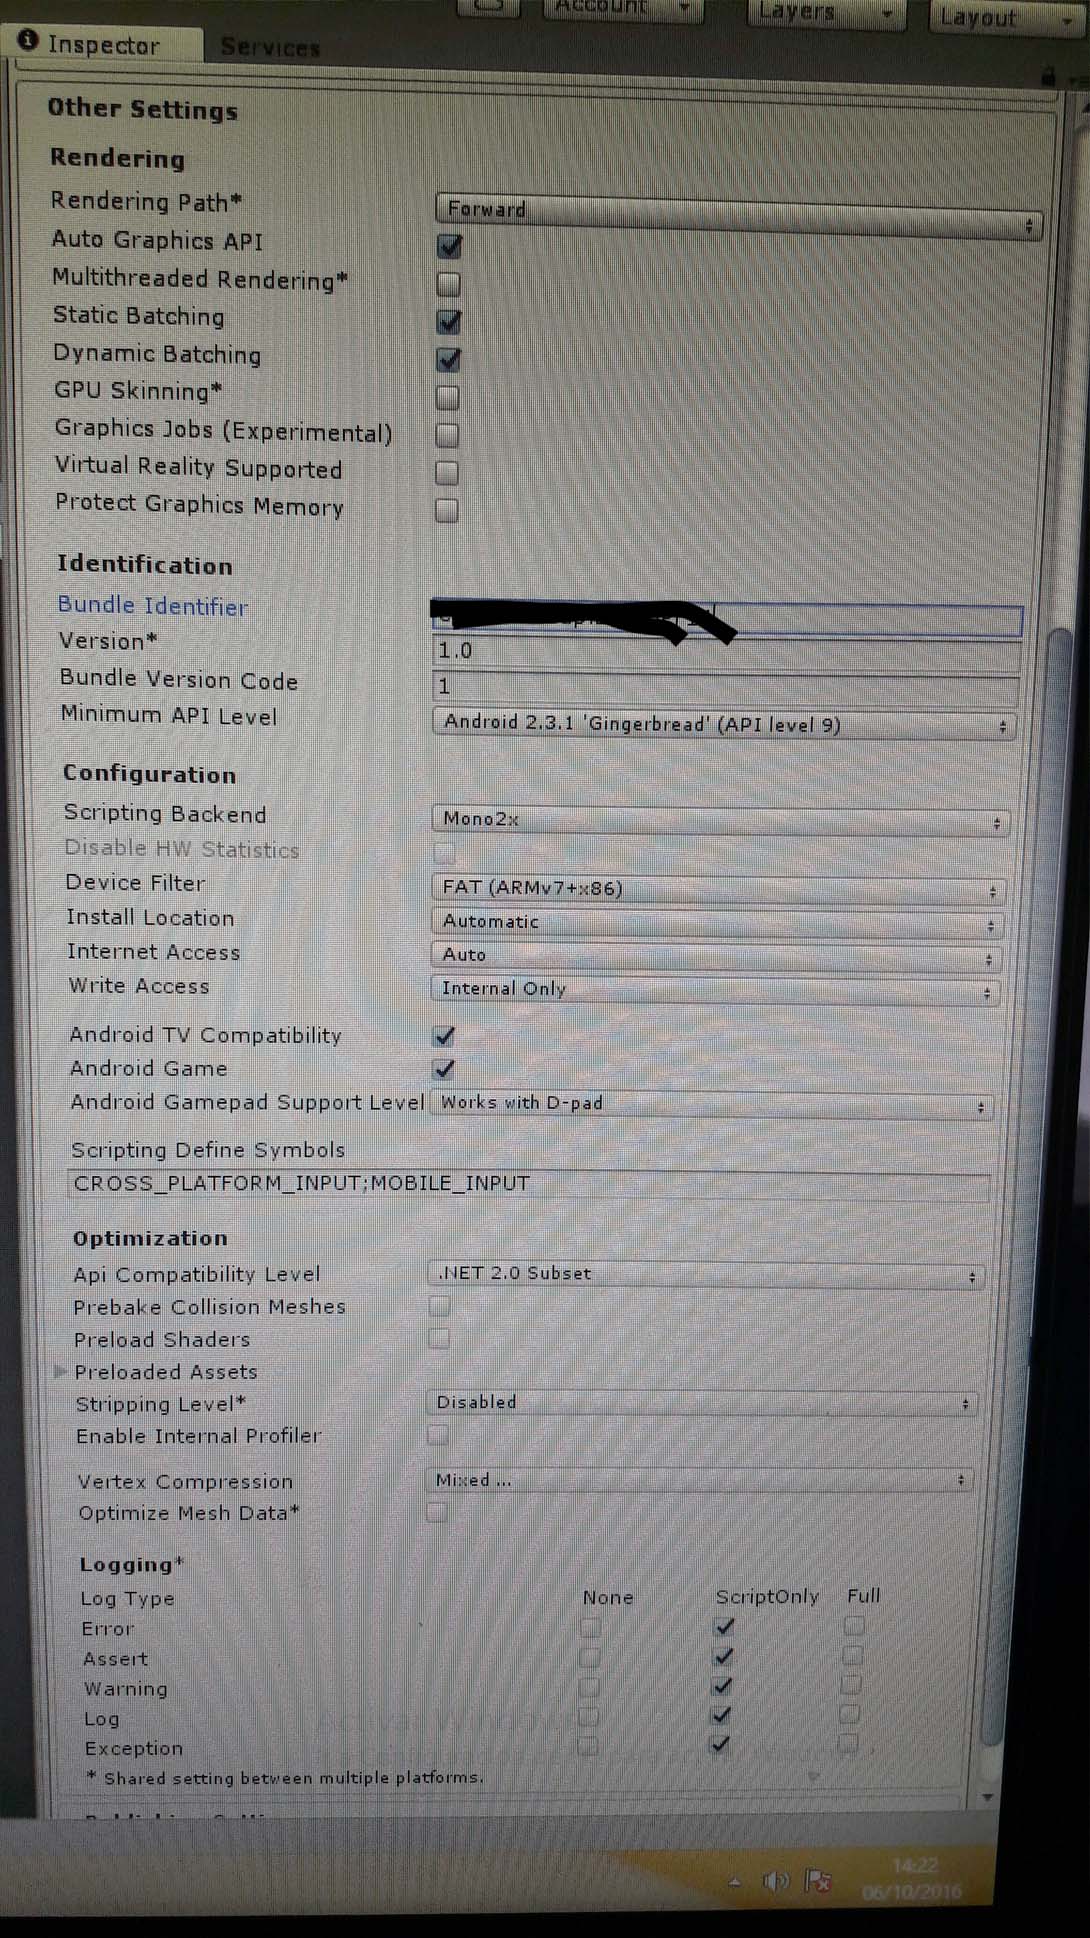
Thank you, I'll take a look into it, see if I can figure it out! btw do you think it could have anything to do with any parameter of the optimization or configuration tab? ( see picture )
Can you post a few screenshots of the game scene in vertical and horizontal game mode?
Perhaps even a short video demonstrating the lag?
That would help a lot, as I now have to assume that it's the GPU which is the limiting part.
Hi! I just let the screen locked on horizontal, since I realized the gameplay is better that way. $$anonymous$$ore space to put the moving buttons on without the fingers blocking the screen... Thanks for all your help. It probably was that the phone had too many objects to render from upclose...
I posted another question if you want to help me with that...I'm a deep well of questions yes...It is google play advertising ID related. Here's the link in case you wanna take a look at it.
http://answers.unity3d.com/questions/1253247/advertising-id-how-important-it-is-how-to-implemen.html
Your answer

Follow this Question
Related Questions
SetActive or SceneManger? 1 Answer
Running GI on a low end cpu 0 Answers
GPU profiling time not adding up properly and GPU taking up lots of time 2 Answers
Difference between GetComponent 2 Answers
