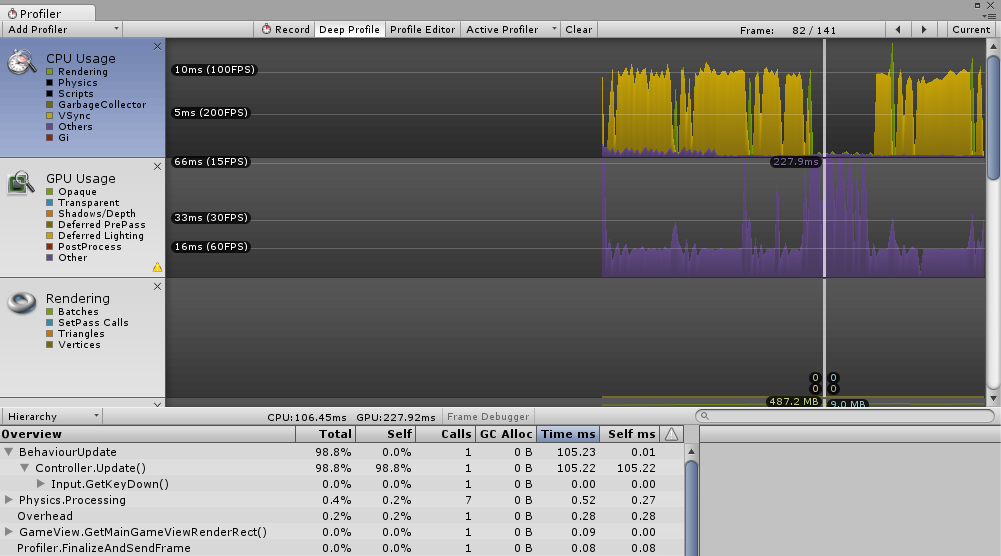
GPU profiling time not adding up properly and GPU taking up lots of time
My basic questions: Why does the GPU processing time spike when performing simple things in the update method of a game object when there is literally nothing to render? And why is the total GPU processing time in the profiler so much higher than what it adds up to from the function call table and what is it doing during that missed time that takes so long?
More Info: I made a simple test project to demonstrate this effect, there is only a single empty game object with nothing else (no cameras or lights) and it has one thing in the update function that just runs a really long for loop that continually divides two numbers (takes ~100 ms to run) when I hit a key. When I hit the key processing time spikes in both the CPU and GPU (see pic, I hit it a bunch there but it happens if I do it just once too) but this is confusing to me as there's no reason for the GPU to be doing anything as far as I'm aware, there isn't even a camera or anything to display.
So then why does it spike higher than the CPU time even and more importantly I can't debug this because nothing appears in the GPU profiler table, it just has 1 call to RenderTexture.SetActive which takes 0 ms despite having deep profile on and it says the total GPU time was 228 ms. Even when not running the for loop the GPU time is at ~15 ms still, what is it doing during that time? One last thing worth mentioning is that this happens with V sync on or off.
This simple example correlates well to what I noticed in my main game and this added GPU time really does contribute significantly to a slow FPS.
(Also, in the pic where it looks like the CPU time dips down it actually goes up a ton to ~100 ms, not down to 0 as the plot would suggest).
I'm using Unity 5.3.3f1, any help greatly appreciated in trying to understand this, thanks!

I feel you. There is not much happening besides rendering static sprites. But randomly these spikes appear in the category "other" and dont add up to the shown time below.

Answer by jmkraemer · Sep 03, 2016 at 02:51 AM
I'm running into a similar issue. Anyone else having this problem?
Answer by jbelmonte · Aug 29, 2017 at 03:58 PM
Some points which may shed light on confusion in the original post:
script time is disabled in the profiler view. Note the box next to "Scripts" is black, so script time is not shown in the graph. You need to click on the box to enable it.
"vsync" is CPU time waiting for vsync and/or GPU. It makes sense that when there is a long CPU stall this value will go to 0.
GPU Usage is entirely "other". Unity isn't too clear on what that label means, but likely this is just the graphic driver waiting for vsync (hence it's nominally 16 ms in your case).
Summary: you've added a big CPU loop in your project as a test, but don't have the corresponding "Scripts" metric enabled in the profiler for the impact to be visible. The profiler output is fairly meaningless without that, and you're inferring the wrong things from it.
Your answer

Follow this Question
Related Questions
Need help profiling first game. Huge GPU spikes? 1 Answer
Physics and Rendering Optimization Issues 0 Answers
How do I optimize my game when I've tried everything and still runs slow? 1 Answer
FindMainCamera from Profiler.CollectUIStats 1 Answer
Why does my fps drop when objects are loaded? (Android) 0 Answers
