Profiler Shows Object.Equals with Strange Percentage
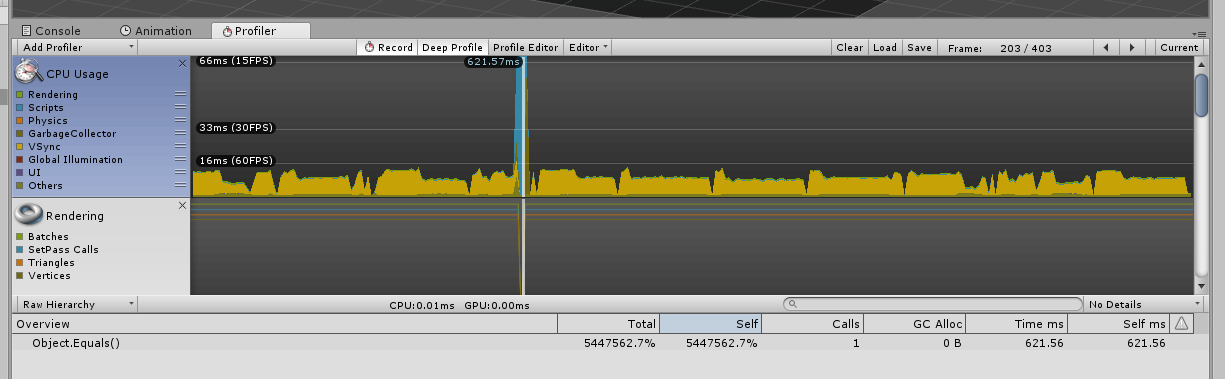
I've got a really long runnning process that takes a couple of seconds, and I wanted to look to see what's happening in the profiler. But when I select the spike, the profiler shows me junk data (see below)
Does anyone know why this might be happening? Is it because it's running for so long?
In the past the profiler had a max samples per frame limit. Such long processes usually would hit that limit when doing deep profiling. It was possible to set this limit to "-1" however it doing so could crash the editor and even your whole PC as the profiler aquired more and more memory from the system (could be 20GB+) so it would have to swap the memory to disk which totally kills the system (response time over 5 $$anonymous$$utes!!).
I'm not sure how Unity now handles the storage of the samples as this setting doesn't exist anymore. In the past when you hit the sample limit the frame was dropped completely. $$anonymous$$y guess is that something similar happend here and it somehow shows the wrong information.
