Profiler Graph values and Overview values dont match!
I am facing this problem where there is a clear spike on the GPU profiler graph (above 30 ms), but in the overview of the profiler there is nothing that is close to 30 ms. I am guessing, the overview section is not showing something as the highest percentage for that instant is 1.4%.I need to know if this is not an issue.
I would like to add that the current scene only contains a moving camera and a couple of background sprites which are being looped.I am using unity 5. 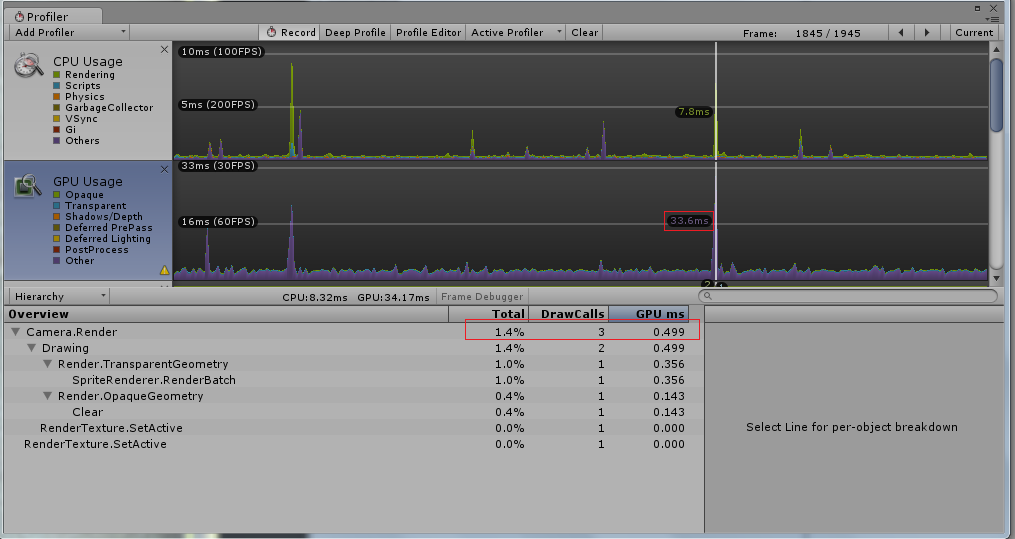
NB: at the same time (where GPU spikes) there are also spikes on the CPU profiler and most time taken is said to be the Gfx.WaitForPresent. I am guessing this is due to the fact i am bound by GPU... but this thread(http://answers.unity3d.com/questions/648382/gfxwaitforpresent.html) suggests this is a wait for vertical sync. But there is no vsync setting turned on both for game and grafix card. moreover if i turn on vsync from quality setting it shows "WaitForTargetFPS" not "Gfx.WaitForPresent"
