Wayback Machinekoobas.hobune.stream
May JUN Jul
Previous capture 13 Next capture
2021 2022 2023
1 capture
13 Jun 22 - 13 Jun 22
sparklines
Close Help
  • Products
  • Solutions
  • Made with Unity
  • Learning
  • Support & Services
  • Community
  • Asset Store
  • Get Unity

UNITY ACCOUNT

You need a Unity Account to shop in the Online and Asset Stores, participate in the Unity Community and manage your license portfolio. Login Create account
  • Blog
  • Forums
  • Answers
  • Evangelists
  • User Groups
  • Beta Program
  • Advisory Panel

Navigation

  • Home
  • Products
  • Solutions
  • Made with Unity
  • Learning
  • Support & Services
  • Community
    • Blog
    • Forums
    • Answers
    • Evangelists
    • User Groups
    • Beta Program
    • Advisory Panel

Unity account

You need a Unity Account to shop in the Online and Asset Stores, participate in the Unity Community and manage your license portfolio. Login Create account

Language

  • Chinese
  • Spanish
  • Japanese
  • Korean
  • Portuguese
  • Ask a question
  • Spaces
    • Default
    • Help Room
    • META
    • Moderators
    • Topics
    • Questions
    • Users
    • Badges
  • Home /
avatar image
1
Question by lkhehe · Apr 15, 2015 at 12:43 PM · androidmemory usageprofilingadb

Puzzle: Why game app on Android takes up much more memory than Unity Profiler reports?

We are profiling our game app on Android 4.4.2 device via Unity’s ADB profiling.

We have set up ADB profiling following the official guide: http://docs.unity3d.com/Manual/Profiler.html

The ADB profiling works fine, when the app is running, Unity Profiler reports its memory usage as following:

Unity Profiler reported Memory usage

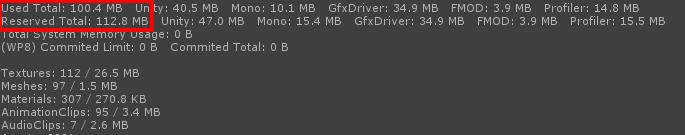
Used Total: 100.4 MB Unity: 40.5 MB Mono: 10.1 MB GfxDriver: 34.9 MB FMOD: 3.9 MB Profiler: 14.8 MB Reserved Total: 112.8MB Unity: 47.0 MB Mono: 15.4 MB GfxDriver: 34.9 MB Profiler: 15.5 MB

Meanwhile, we are also running another performance test tool (i.e. Emmagee, https://github.com/NetEase/Emmagee) to monitor the app, which can monitor CPU, memory, network traffic, battery current and etc. However, the memory usage of the app reported by Emmagee tool is much larger:

Emmagee tool reported Memory info

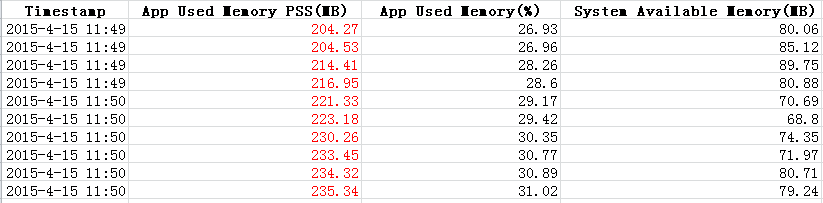
As shown above, Unity Profiler reported 112.8M memory is totally reserved for running the app, but Emmagee tool reported >200M PSS memory is used. Obviously, more than 90M memory taking up is happened somewhere by something that Unity Profiler does not take into account.

(We also tried other performance monitoring tool for Android apps, e.g. APT, and the result is similar to what Emmagee reported. The extra memory usage problem remains.)

We noticed that the Unity Profiler itself would take up ~15M memory, which is included in the profiler’s report. Also, we knew that PSS memory includes proportional shared libraries with other processes, but 90M+ extra is such large amount considering that Unity Profiler only reported 112.8M totally.

Our puzzle remained: Where does the 90M+ memory come from? How are they used by the app? Why Unity Profiler does not report the extra memory? What can we do for reducing the extra memory and the total PSS memory of the running app, and/or get it close to what Unity Profiler reports?

Any help could be appreciated!

up.png (43.3 kB)
eg.png (12.6 kB)
Comment
Add comment · Show 4
10 |3000 characters needed characters left characters exceeded
▼
  • Viewable by all users
  • Viewable by moderators
  • Viewable by moderators and the original poster
  • Advanced visibility
Viewable by all users
avatar image givemedoor · Apr 23, 2015 at 08:43 AM 0
Share

same problem puzzle me too. please help!!!

avatar image NewbilityShanghai · Oct 30, 2015 at 11:12 AM 0
Share

Also the same... It drives me mad about the lack of information..

avatar image pachash · Oct 06, 2016 at 10:21 AM 0
Share

Hi! Any positive news on that? I seem to have a similar issue but on iOS: https://forum.unity3d.com/threads/5-4-1-unitys-profiler-device-memory-consumption-differs-from-xcode-numbers.434871/

BTW, what version of Unity do you use?

avatar image tomerpeledNG · Feb 05, 2018 at 12:29 PM 0
Share

Also occurs on 2017.3.03p

2 Replies

· Add your reply
  • Sort: 
avatar image
0

Answer by tarasfromlviv · Oct 30, 2015 at 01:36 PM

The thing most likely is that Unity Profiler Profiles only things that are actually your game related (your sandboxed game info) and external tools show you everything including all the Unity player consumes at total. If the Unity profiler showed you everything unrelated to your game and engine internals there would have been a lot of noise in the profiler. So the profile shows you the memory you have the direct influence on withing your project.

The thing is you shouldn't worry about the things you cannot change, maximum you can do is to be careful withing what you are doing within the app.

Comment
Add comment · Share
10 |3000 characters needed characters left characters exceeded
▼
  • Viewable by all users
  • Viewable by moderators
  • Viewable by moderators and the original poster
  • Advanced visibility
Viewable by all users
avatar image
0

Answer by NewbilityShanghai · Nov 02, 2015 at 02:46 PM

With further research, I can give a guess. Here is my test:

  1. Test my game with a totally empty scene when start, memory cost is 68.3MB.(Notice, the scene is totally empty, no assets is loaded)

  2. I try to remove a lot prefabs in my game, generate the apk file, run the game start with the empty scene again, the memory cost is 38.46MB.

  3. I try to add some of the prefabs back to my game and run the game again and again, I noticed that when I add very complicated prefabs back, the memory cost will be tremendous.

Here's my guess:

Unity will preLoad the "prefab structure" into memory on android, this is why you will need extra memory even the prefab is never clone in current scene. Only the structure but not the assets such as texture will be "Preloaded".

The way to solve the problem:

I tried to remove all the complicated prefabs, instead to create new scene and make new gameobjects in the scene, the memory cost appears reasonable.

The problem appears when we use large and complicated prefabs to construct the level design, and load it when the scene is started. Also, the theory is only my guess, I look forward to someone can explain this more "Officially" or something.

Comment
Add comment · Share
10 |3000 characters needed characters left characters exceeded
▼
  • Viewable by all users
  • Viewable by moderators
  • Viewable by moderators and the original poster
  • Advanced visibility
Viewable by all users

Your answer

Hint: You can notify a user about this post by typing @username

Up to 2 attachments (including images) can be used with a maximum of 524.3 kB each and 1.0 MB total.

Follow this Question

Answers Answers and Comments

7 People are following this question.

avatar image avatar image avatar image avatar image avatar image avatar image avatar image

Related Questions

Puzzle: Why game app on Android takes up much more memory than Unity Profiler reports? 0 Answers

Certificate problems when installing APK file on Android phone from command line 1 Answer

Error trying to build for android. 2 Answers

Why does the internal profiler show no GPU usage? 1 Answer

Android profiling, fps, vsync 1 Answer


Enterprise
Social Q&A

Social
Subscribe on YouTube social-youtube Follow on LinkedIn social-linkedin Follow on Twitter social-twitter Follow on Facebook social-facebook Follow on Instagram social-instagram

Footer

  • Purchase
    • Products
    • Subscription
    • Asset Store
    • Unity Gear
    • Resellers
  • Education
    • Students
    • Educators
    • Certification
    • Learn
    • Center of Excellence
  • Download
    • Unity
    • Beta Program
  • Unity Labs
    • Labs
    • Publications
  • Resources
    • Learn platform
    • Community
    • Documentation
    • Unity QA
    • FAQ
    • Services Status
    • Connect
  • About Unity
    • About Us
    • Blog
    • Events
    • Careers
    • Contact
    • Press
    • Partners
    • Affiliates
    • Security
Copyright © 2020 Unity Technologies
  • Legal
  • Privacy Policy
  • Cookies
  • Do Not Sell My Personal Information
  • Cookies Settings
"Unity", Unity logos, and other Unity trademarks are trademarks or registered trademarks of Unity Technologies or its affiliates in the U.S. and elsewhere (more info here). Other names or brands are trademarks of their respective owners.
  • Anonymous
  • Sign in
  • Create
  • Ask a question
  • Spaces
  • Default
  • Help Room
  • META
  • Moderators
  • Explore
  • Topics
  • Questions
  • Users
  • Badges