- Home /
How to debug or otherwise troubleshoot a specific graphics frame (not current)?
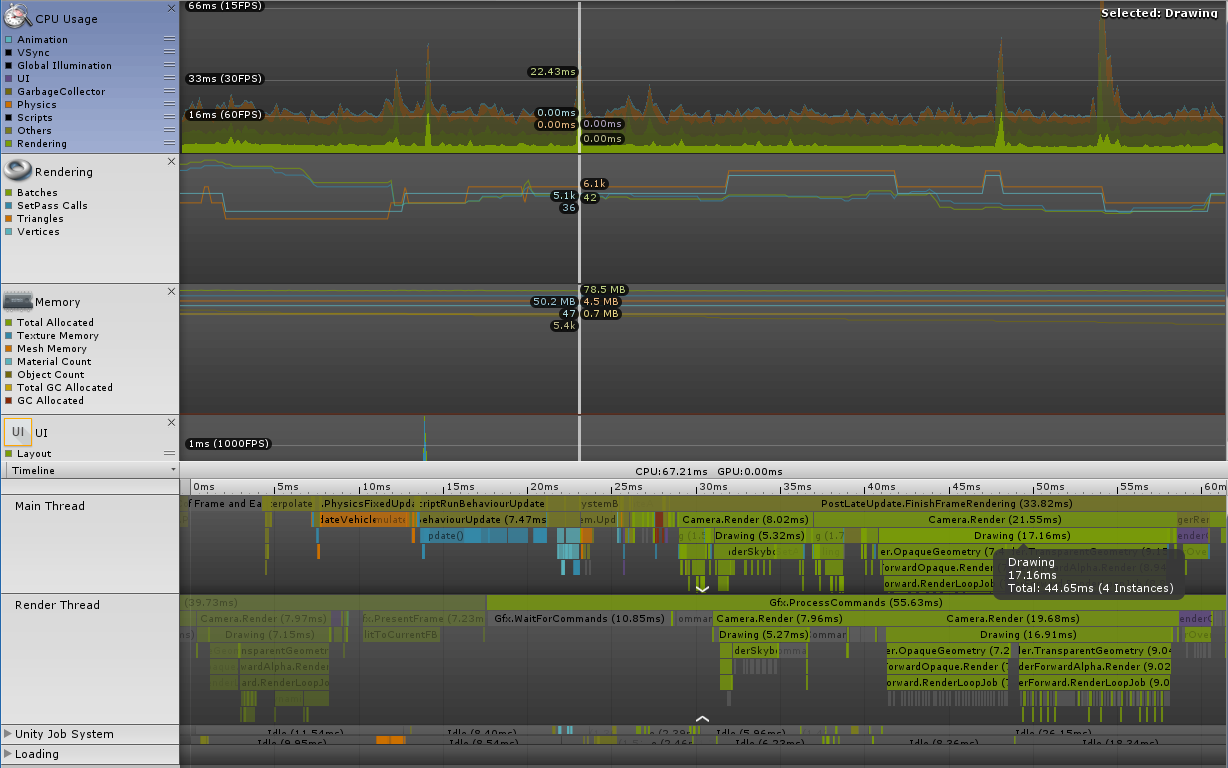
So I've got these CPU spikes which cause my game to intermittently skip a little. I collected the below screenshot to illustrate, which is a capture from my test device (an Android phone). I've disqualified the usual culprit for this sort of problem (garbage collector), instead narrowing it to the drawing phase of rendering. Spikes last for only one or two consecutive frames, and take 10x longer than most frames. My latest idea is using the frame debugger to compare a 'normal' or 'baseline' frame with one of the spikes, but because the spikes are sort of random and infrequent, I've never succeeded in capturing one of the spike frames by activating the frame debugger.
How can I investigate the drawing phase for a specific game frame which is not the current frame? Can I somehow use the frame debugger for this? Is there a better tool for digging into this problem?
Unless I get some good advice from you all, my next move is to start disabling game features one at a time until the problem disappears, which will be a very expensive and inefficient approach.
Thanks for reading!

Your answer

Follow this Question
Related Questions
How to change drawcall order? 1 Answer
What can I do to increase the performance of a scene containing 6 cameras? 1 Answer
StencilMaterial class 0 Answers
Text Update demands too much performance 0 Answers
