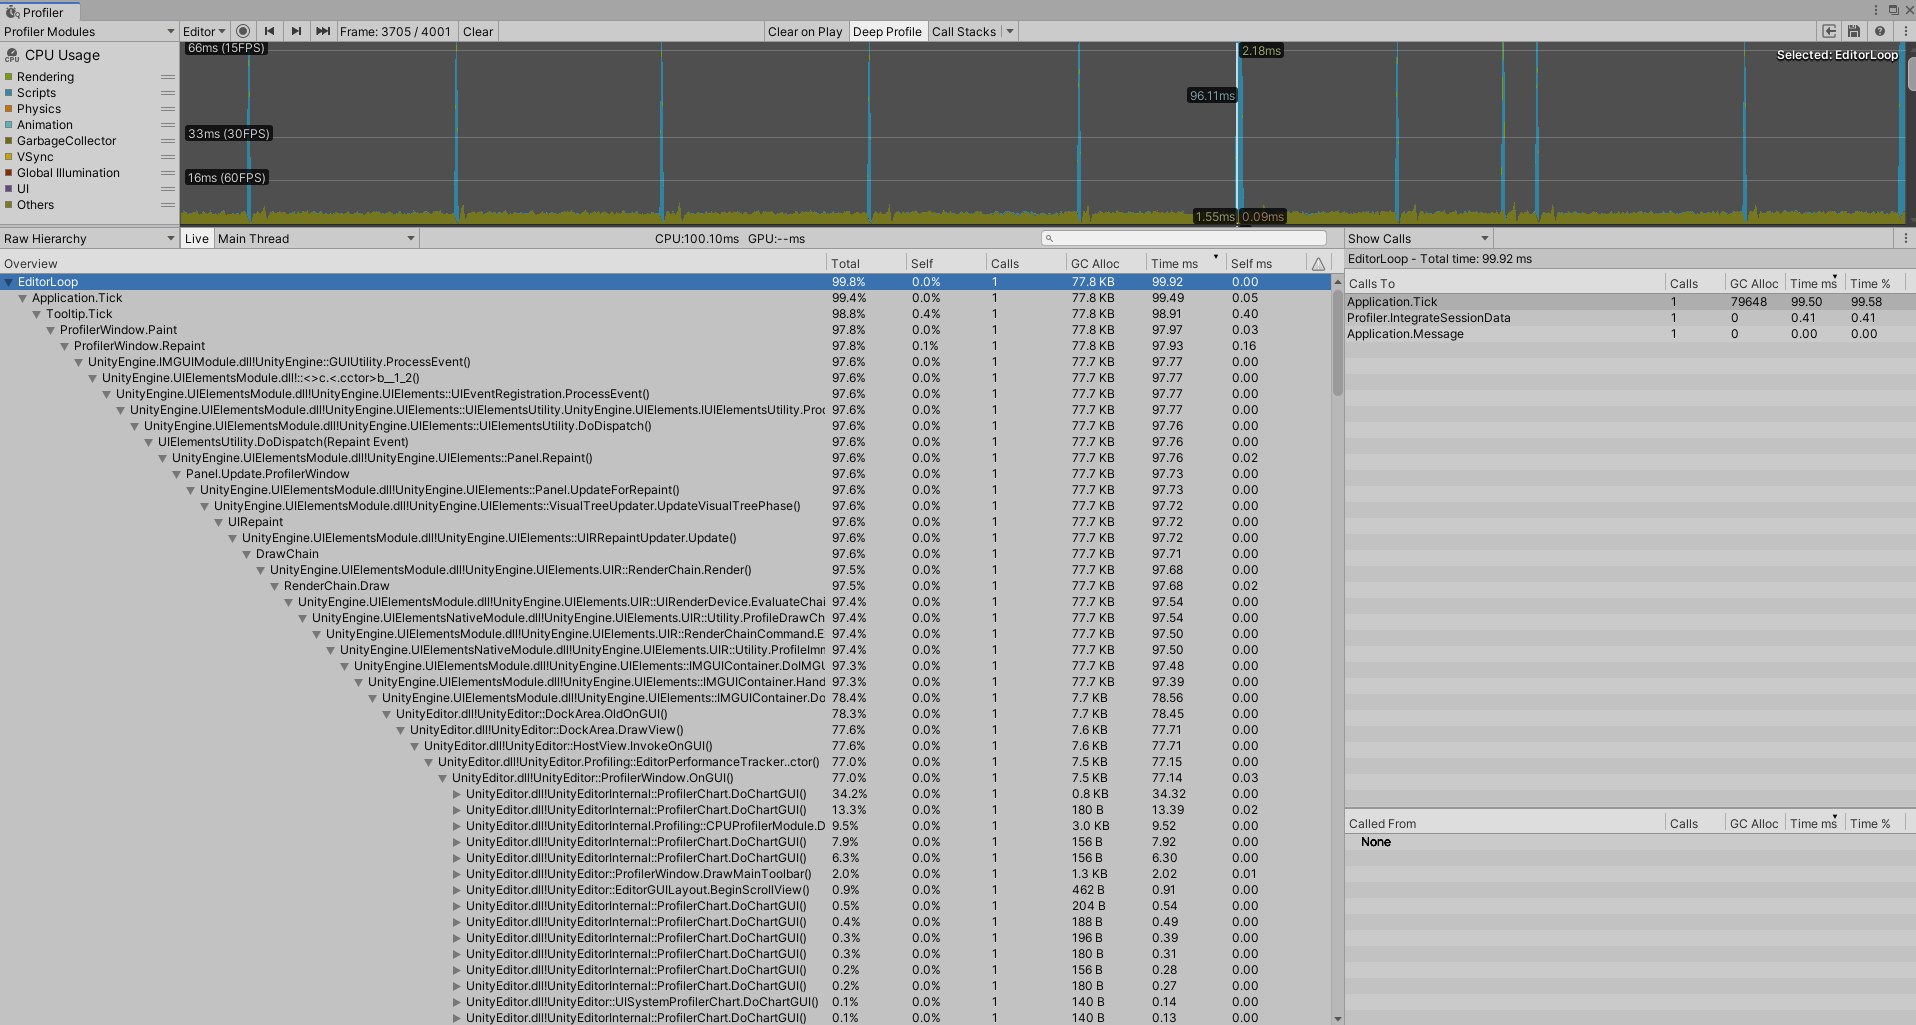
Unity profiler, Editor Loop Using %90 all the time and making spikes
i figure out it on my project but tested it on new empty project with default scene, i was using version 2020.1.0f1 than updated to 2020.1.5f1 but result was same. Editor loop always at %90 percent.(I can see that spikes in playMode profiler too) i searched a lot but found nothing. Anyone know how to fix it? Could I have enabled the wrong setting or somethingelse?
.
Currently installed packages ( is one of it cousing this?)
JetBrains Rider Editor
Test Framework
TextMeshPro
Timeline
Unity Collaborate
Unity UI
Visual Studio Code Editor
Visual Studio Editor
.
olso i'm using unity remote 5 but while i was testing it i plugged it out and restarted unity.
.
if it is not fixable would you suggest me free profiler that i can use with unity. Thanks!
.
 When i minimize unity, that long yellow spike is happening (editorLoop/application.idle) i don't know if its a problem too.
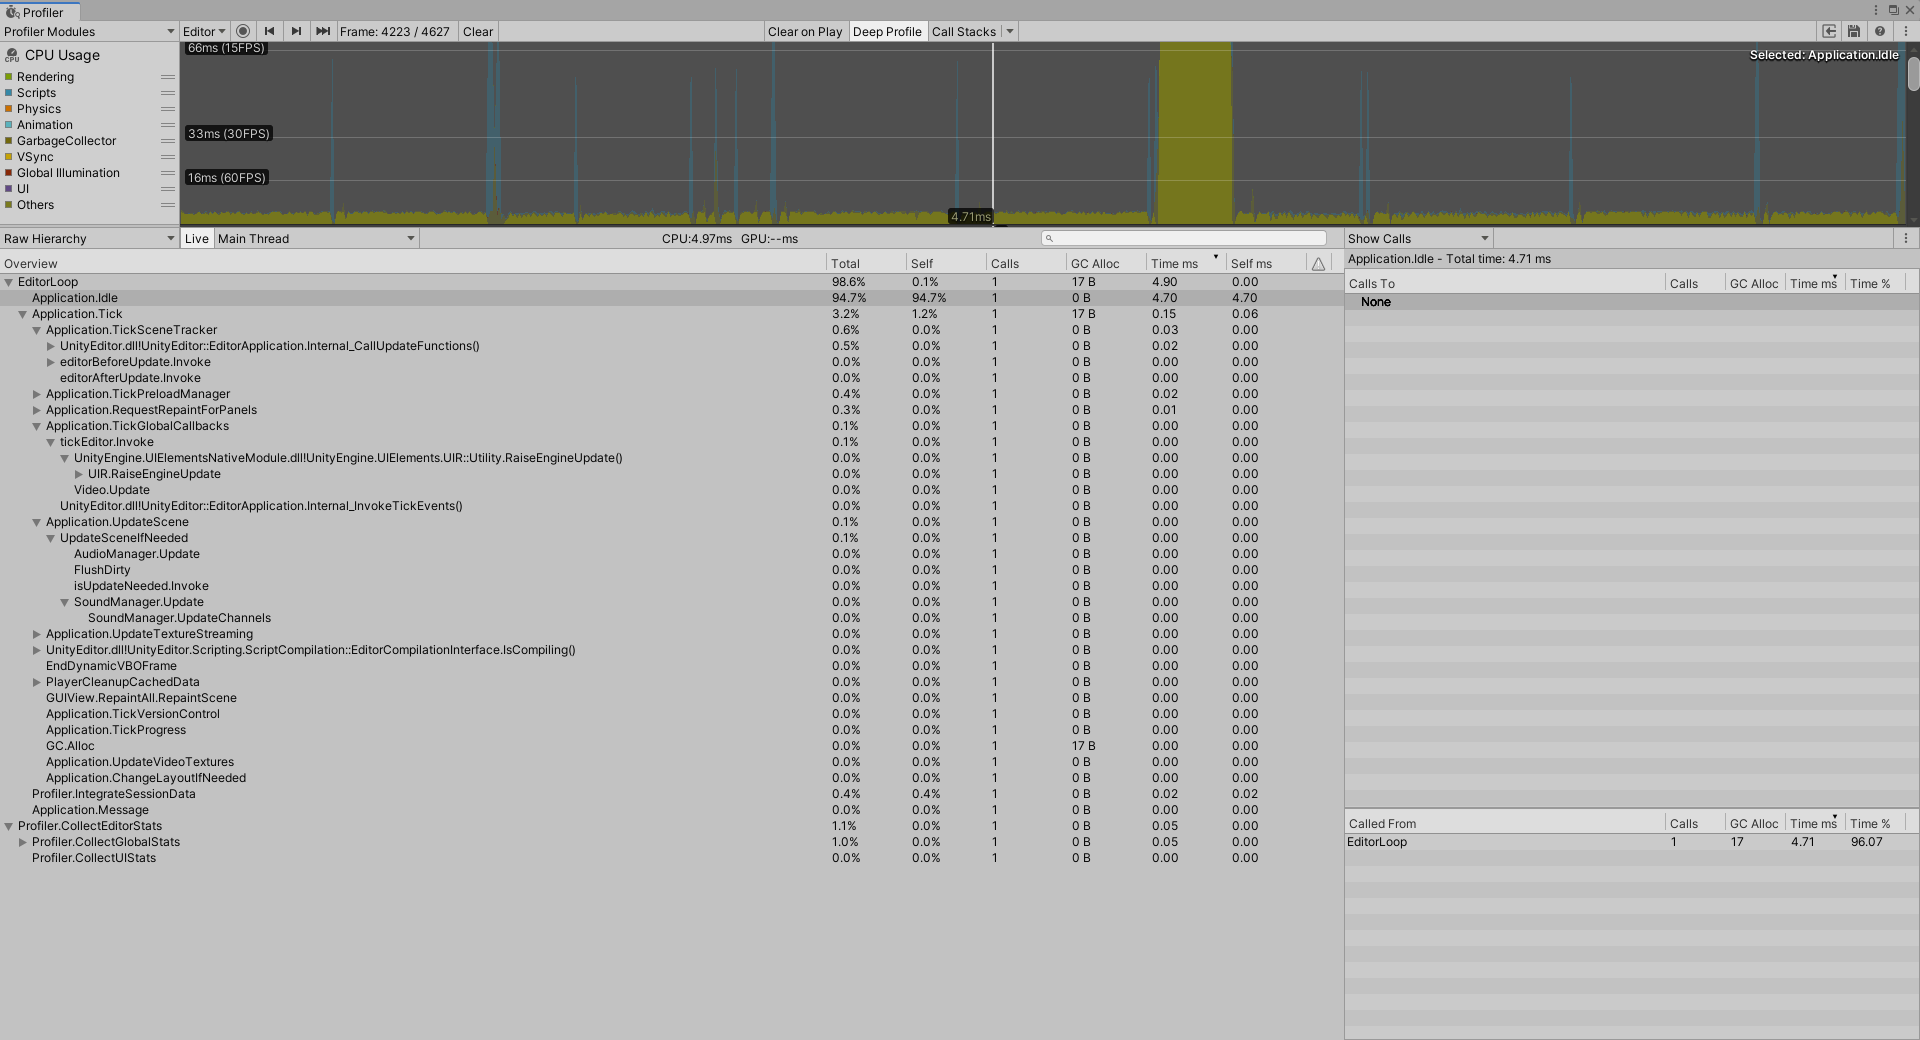
I've had this problem for the past 2 days, when I checked task manager Google Chrome was using 60% of my CPU and that was what caused the editor to lag and the spikes too, try checking your browser or your background apps in general it might help, Good Luck! @nizameddinkale
