Wayback Machinekoobas.hobune.stream
May JUN Jul
Previous capture 11 Next capture
2021 2022 2023
1 capture
11 Jun 22 - 11 Jun 22
sparklines
Close Help
  • Products
  • Solutions
  • Made with Unity
  • Learning
  • Support & Services
  • Community
  • Asset Store
  • Get Unity

UNITY ACCOUNT

You need a Unity Account to shop in the Online and Asset Stores, participate in the Unity Community and manage your license portfolio. Login Create account
  • Blog
  • Forums
  • Answers
  • Evangelists
  • User Groups
  • Beta Program
  • Advisory Panel

Navigation

  • Home
  • Products
  • Solutions
  • Made with Unity
  • Learning
  • Support & Services
  • Community
    • Blog
    • Forums
    • Answers
    • Evangelists
    • User Groups
    • Beta Program
    • Advisory Panel

Unity account

You need a Unity Account to shop in the Online and Asset Stores, participate in the Unity Community and manage your license portfolio. Login Create account

Language

  • Chinese
  • Spanish
  • Japanese
  • Korean
  • Portuguese
  • Ask a question
  • Spaces
    • Default
    • Help Room
    • META
    • Moderators
    • Topics
    • Questions
    • Users
    • Badges
  • Home /
avatar image
3
Question by Lolop109 · Jul 06, 2015 at 05:06 PM · profilergpuspikes

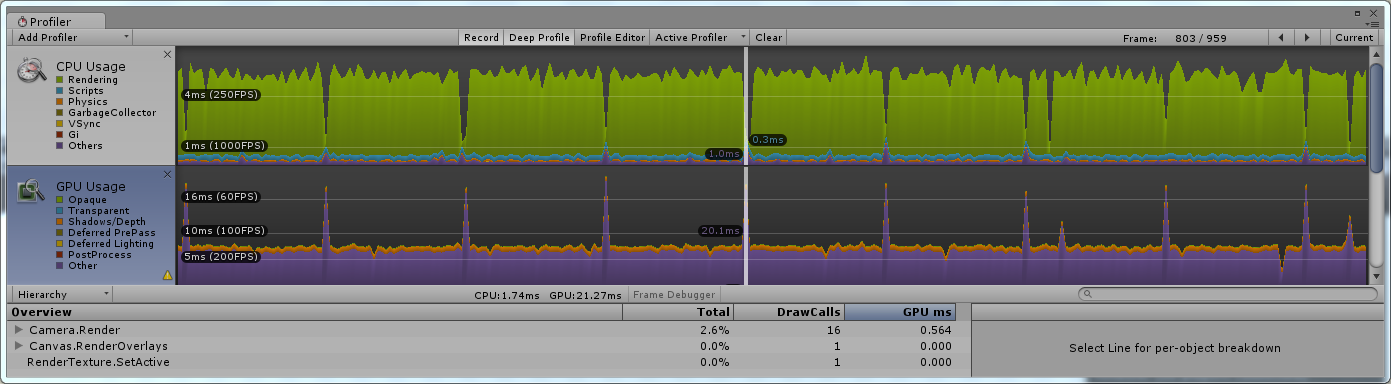
GPU spikes in profiler

So i've just recently decided to start on making my own game. There is a lot of things i don't know /understand, but i've been trying to keep performance as best i can (So i know the best way of doing everything for the future). The green portion of the CPU usage has been bugging me for a long time (most of the time it takes between 94-98% of the total time). I think the cause is the GPU, which has spikes that go up to 90ms sometimes.

I have no idea what's causing this, the scene is basically empty. Any objects i have loaded are disabled and the scene is static (so every frame should be the same). Yet this "Other" wont go away. I have a GTX 980, so it's not like i have an old card or anything, so i'm at a loss. Anyone got any idea's?

The Rendering profiler is completely flat, it has 12 draw calls, 1.8k tris, and 5.2k verts. I honestly have no idea where those are even coming from seeing as my scene is a whole load of empty game objects and like 3 cubes.

Here is a picture of the profiler:

alt text

capture.png (189.8 kB)
Comment
Add comment · Show 3
10 |3000 characters needed characters left characters exceeded
▼
  • Viewable by all users
  • Viewable by moderators
  • Viewable by moderators and the original poster
  • Advanced visibility
Viewable by all users
avatar image Kerihobo · Dec 21, 2015 at 12:52 AM 0
Share

How did you go with this? I have the same problem.

avatar image timonw · Jul 15, 2016 at 12:41 PM 0
Share

I have the exact same problem. $$anonymous$$y graphic card is also the $$anonymous$$SI Geforce 980 with the latest driver. Did anyone find a solution to this?

avatar image Lolop109 timonw · Jul 15, 2016 at 01:57 PM 0
Share

I believe the spikes are to do with Vsync. It's a little bit weird how it works, but it does that to limit the FPS to the refresh rate of the monitor.

Try going "Edit -> Project Settings -> Quality" then over where the inspector is you should be able to scroll down and find a "V Sync Count" property. If you set that to "Don't Sync" the large spikes should go away. Now be aware you will probably still see some unstable-ness, but it won't be as large as before. Also if you notice that it is still spiking, make sure that Vsync is turned off (Or set to application preference) in the Nvidia control panel.

This also has the effect of unlocking the frame rate, so you will see what FPS you game is truly running at. On a mostly blank game this will be thousands of FPS, and will make your hardware work needlessly hard. If the Vsync was the problem, i'd suggest turning it back on.

2 Replies

· Add your reply
  • Sort: 
avatar image
1

Answer by Dokkanosaur · Aug 19, 2017 at 02:17 AM

If you have the same problem I had, then it's likely that what you're actually seeing is the update call to the profiler itself.

Try hiding the profiler (click a different tab while it's running so you can't see it) or re-sizing the profiler. You'll notice the "other" portion of the GPU will disappear when hidden, or stay spiked when dragged.

The act of observing performance is affecting performance. "Schrodinger's Profiler", perhaps?

Comment
Add comment · Show 1 · Share
10 |3000 characters needed characters left characters exceeded
▼
  • Viewable by all users
  • Viewable by moderators
  • Viewable by moderators and the original poster
  • Advanced visibility
Viewable by all users
avatar image psykojello2 · Sep 20, 2017 at 04:10 AM 0
Share

Heisenberg's Profiler perhaps? :)

That spike was annoying me, thank you for your answer! I hope that's all it was.

avatar image
0

Answer by forestluch · Feb 21, 2020 at 08:25 AM

Thank mate, I am also confused about this.

Comment
Add comment · Share
10 |3000 characters needed characters left characters exceeded
▼
  • Viewable by all users
  • Viewable by moderators
  • Viewable by moderators and the original poster
  • Advanced visibility
Viewable by all users

Your answer

Hint: You can notify a user about this post by typing @username

Up to 2 attachments (including images) can be used with a maximum of 524.3 kB each and 1.0 MB total.

Follow this Question

Answers Answers and Comments

7 People are following this question.

avatar image avatar image avatar image avatar image avatar image avatar image avatar image

Related Questions

Huge "other" in Gpu Profile ! 4 Answers

Unaccounted time between: WaitForTargetFPS and GPUProfiler.EndQueries 0 Answers

Wierd profiler hence in GPU 0 Answers

What is this shader? 1 Answer

High GPU Usage Android 0 Answers


Enterprise
Social Q&A

Social
Subscribe on YouTube social-youtube Follow on LinkedIn social-linkedin Follow on Twitter social-twitter Follow on Facebook social-facebook Follow on Instagram social-instagram

Footer

  • Purchase
    • Products
    • Subscription
    • Asset Store
    • Unity Gear
    • Resellers
  • Education
    • Students
    • Educators
    • Certification
    • Learn
    • Center of Excellence
  • Download
    • Unity
    • Beta Program
  • Unity Labs
    • Labs
    • Publications
  • Resources
    • Learn platform
    • Community
    • Documentation
    • Unity QA
    • FAQ
    • Services Status
    • Connect
  • About Unity
    • About Us
    • Blog
    • Events
    • Careers
    • Contact
    • Press
    • Partners
    • Affiliates
    • Security
Copyright © 2020 Unity Technologies
  • Legal
  • Privacy Policy
  • Cookies
  • Do Not Sell My Personal Information
  • Cookies Settings
"Unity", Unity logos, and other Unity trademarks are trademarks or registered trademarks of Unity Technologies or its affiliates in the U.S. and elsewhere (more info here). Other names or brands are trademarks of their respective owners.
  • Anonymous
  • Sign in
  • Create
  • Ask a question
  • Spaces
  • Default
  • Help Room
  • META
  • Moderators
  • Explore
  • Topics
  • Questions
  • Users
  • Badges