What causes ShaderLab memory to grow?
I have an android app with an .apk size of 451MB. This app is frequently running out of memory on the device I'm using to test (the particular device has about 1.8 GB of usable memory for the app before low memory killer kicks in).
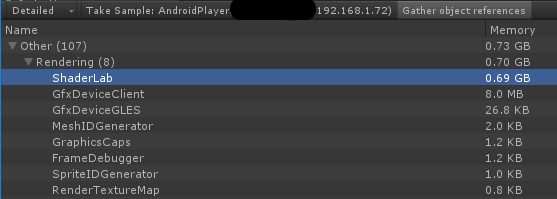
When looking in the profiler, Unity is reporting ShaderLab occupying .6GB (!)
Does anyone know what causes ShaderLab to occupy so much memory?
Better yet, does anyone know how to pre-compile all shaders so that ShaderLab doesn't run at runtime at all (I don't have any scripts creating shaders at runtime, so I would think that I shouldn't need to compile any shaders at runtime)?
So far I've tried (using Unity 2017.4.1f1 and 2018.2.19f1):
Stripping and using shader variant collections as detailed here: https://docs.unity3d.com/Manual/OptimizingShaderLoadTime.html
bundling all materials / shaders into a separate asset bundle and putting it into the streaming assets folder, and loading that asset bundle at runtime on demand.
Using a custom version of the standard shader and removing unused multi_compile* keywords (for example, on mobile we aren't using realtime shadows, so I've removed all of the realtime shadow passes and multi_compile_fwdadd_fullshadows from the standard shader and switched all of our materials to using it). I've also removed the deferred passes from the custom standard shader.
The result of #3 above resulted in fewer shader variants being compiled, however "ShaderLab" still occupies between .6 and .7 GB in the profiler:

If it helps any, the project is using 313 materials and 33 shaders
Answer by CerebralFrost · Jan 21, 2019 at 08:14 PM
I'm still not 100% sure how to control ShaderLab's memory usage, but doing the things I mentioned above, in addition to the step below, helped reduce the memory usage in my project by about 200MB. The thing that I was missing was that not all of the shaders were being included in the asset bundle - specifically the built in shaders. If the shaders aren't in the asset bundle (even if the materials referencing them are), they will be duplicate-included in subsequent asset bundles that reference them. so to add to the steps above:
0) Remove usage of any and all 'hidden' built-in shaders - replace with 'custom' copies of the shaders from Unity's repo, and make sure those shaders are included in the asset bundle from step 2. The only shader that I found that can't be switched out this way is the error shader.
In the original screenshot, I see 0.69 GB (690 $$anonymous$$B). You mentioned reducing by 200$$anonymous$$B, so does that mean you are still seeing 500$$anonymous$$B of memory usage from shaders on mobile?
Yeah, that's about right, just did a profile to double check, and it's sitting at 485.1 $$anonymous$$B for ShaderLab
Answer by matheus_inmotionvr · Feb 27, 2020 at 11:24 AM
I was running into the same problem and a simple Unity upgrade (from 2019.2.15 to 2019.2.21) fixed it. Before, ShaderLab's memory consumption would hit 250Mb, not it doesn't go over 30Mb.
This forum thread might be relevant because it discusses the same issue.
Your answer

Follow this Question
Related Questions
Memory Profiler does not detect my mobile 0 Answers
Does using extra scenes use more memory? 1 Answer
My game randomly crashes on some devices why ? and how do i fix ? 1 Answer
Memory Issues while App Launching,Memory Spike right before Splash Screen(Cold Start?) 0 Answers
What is the best way to deep profile memory usage ? 1 Answer
