Profiler.BeginSample doesn't work
I have a button that simply writes to a log, and does a Profiler.BeginSample (with an EndSample). I can see the log, but I don't see the sample in the profiler. I have Development Build checked, and I'm experiencing this problem in the editor, in a stand-alone PC build, and on my iPad. I also have a #define ENABLE_PROFILER at the top of the script that calls BeginSample.
Why might this not be working, and what can I do to address it?
Thank you.
If you call a method once per button click which does something like...
 public void OnClick()
 {
     Profiler.BeginSample("Example");
     System.Threading.Thread.Sleep(1000);
     Profiler.EndSample();
 }
Then you have to scrub back to the frame in the profiler to where the click happened (it won't show up on any of the other frames). No, there's no simple way of knowing when that happened unless you had a big spike there. The actual sample label will be nested within some method so you may have to dig around for it. Other than that I don't think you have to do anything in the editor to see it.
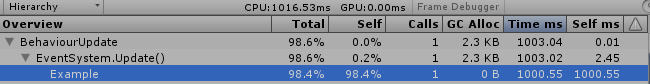
If you were responding to an onClick callback from Unitys Button UI, it should be nested under BehaviourUpdate/EventSystem.Update(), as shown in the image below.
As for reasons why your live code won't work, one possibility that springs to $$anonymous$$d would be a thrown exception after the file has been written, causing EndSample to never get called. Other than that, I don't really know. You do call EndSample in the same stack/frame right?
Yeah. I do a log before the BeginSample and after the EndSample, and both show up in the console, so I know both the Begin and the End are being called. But when I look in the profiler, my sample is nowhere to be found.
So it seems I needed to add a #define ENABLE_PROFILER to the top of my script (I had it at the top of a different script). Once I did that, my sample now appears in the profiler. The script is from an external DLL, so I don't know if that was a factor or not. I'm also not sure where the appropriate place for that define should be, but the current plan is to just put it at the top of each script as I profile. $$anonymous$$gestions for a better location appreciated.
Thanks for the help!
app$$anonymous$$is-mike: Just try to remove the define and try again. does it still appear in the profiler? I guess so, you didn't find the Example because there was no big spike in the Timeline I guess.
Does the method you profile need to be declared public? I say no. Also the #define seems to be for me not necessary.
