Random FPS drop during gameplay
I have a relatively simple 2d game which I have been testing on my IOS device. While playing the game, I noticed that the FPS would randomly drop from 60 (the target framerate) to between 20-40. The FPS would go back up shortly after the drop.
I investigated some more by running the profiler and was able to see a series of spikes in the rendering graph. Within the hierarchy I see that the "Semaphore.WaitForSignal" process under "Gfx.WaitForPresentOnGfxThread" spiked to around 50%.
The timeline view shows a jump in several processes' time. One thing I noticed was that the "Camera.Render" task increased in time during the spike and wouldn't go back down even after the spike.
I have attached some screenshots of the profiler. Any help would be greatly appreciated!
Hierarchy View: 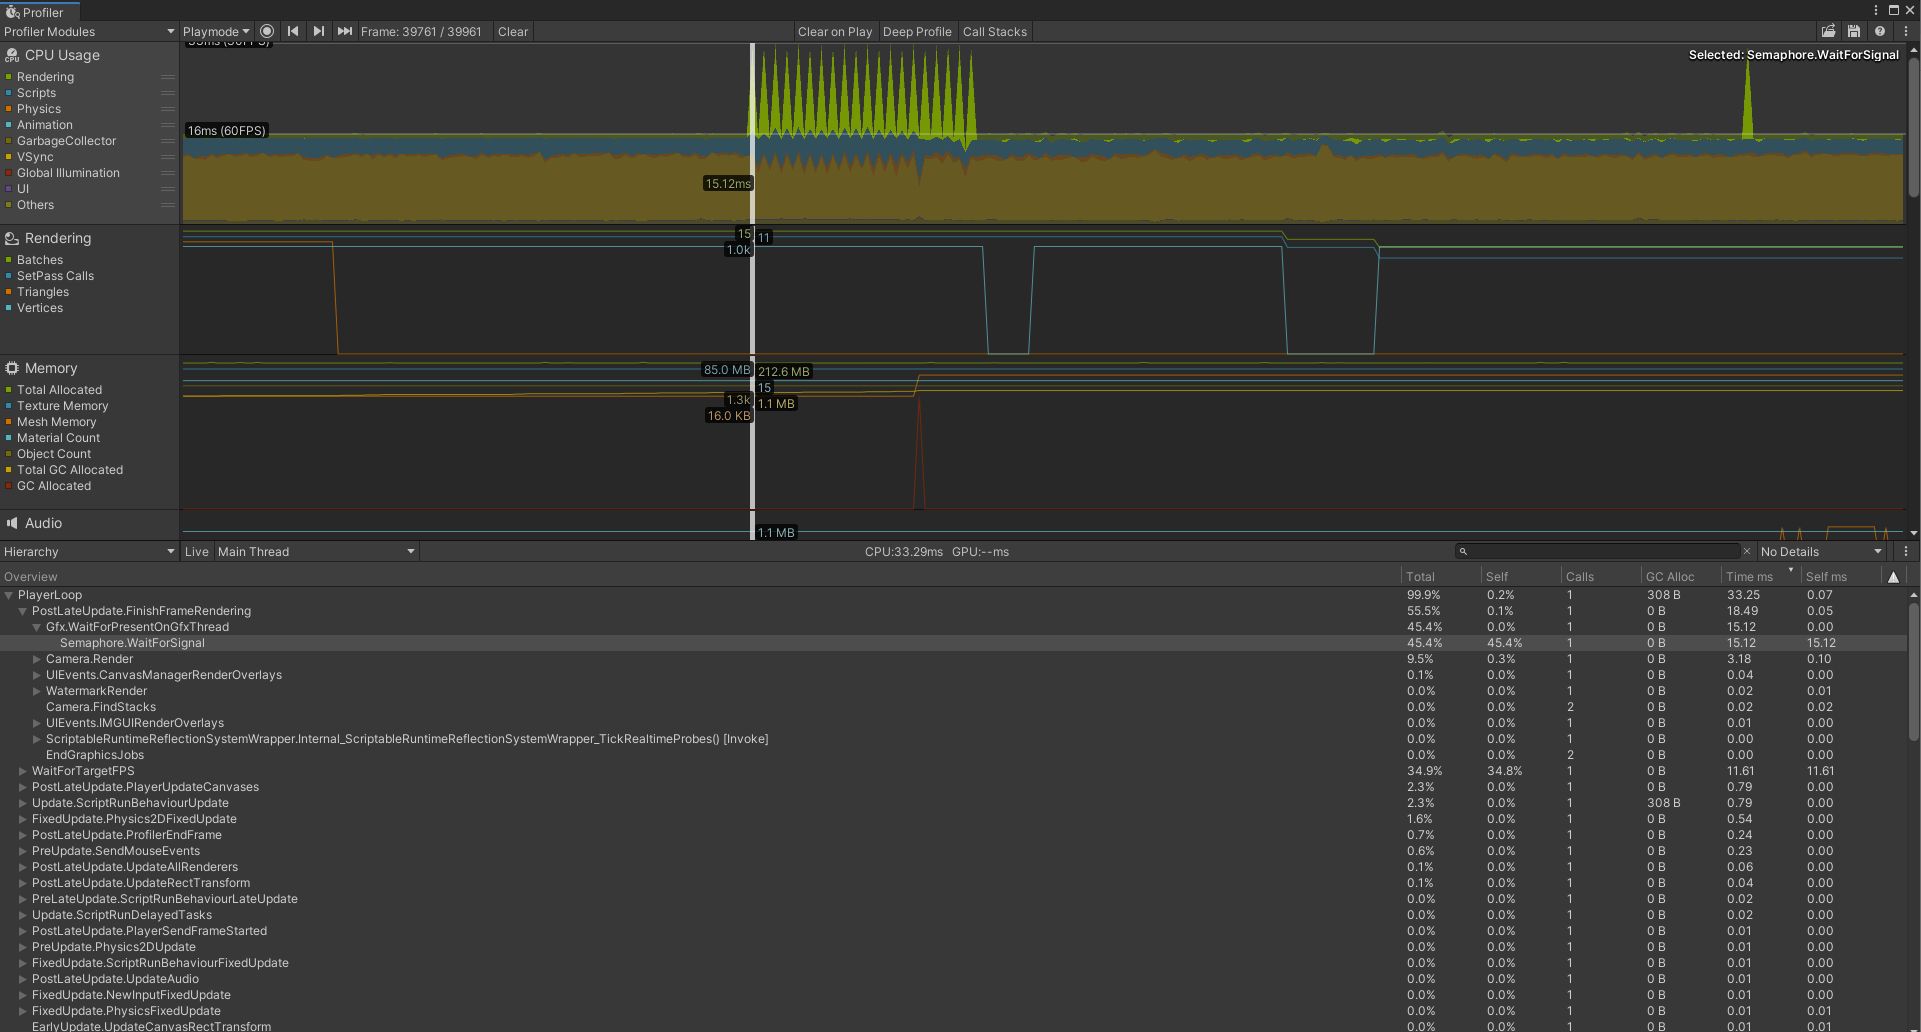
Timeline View: 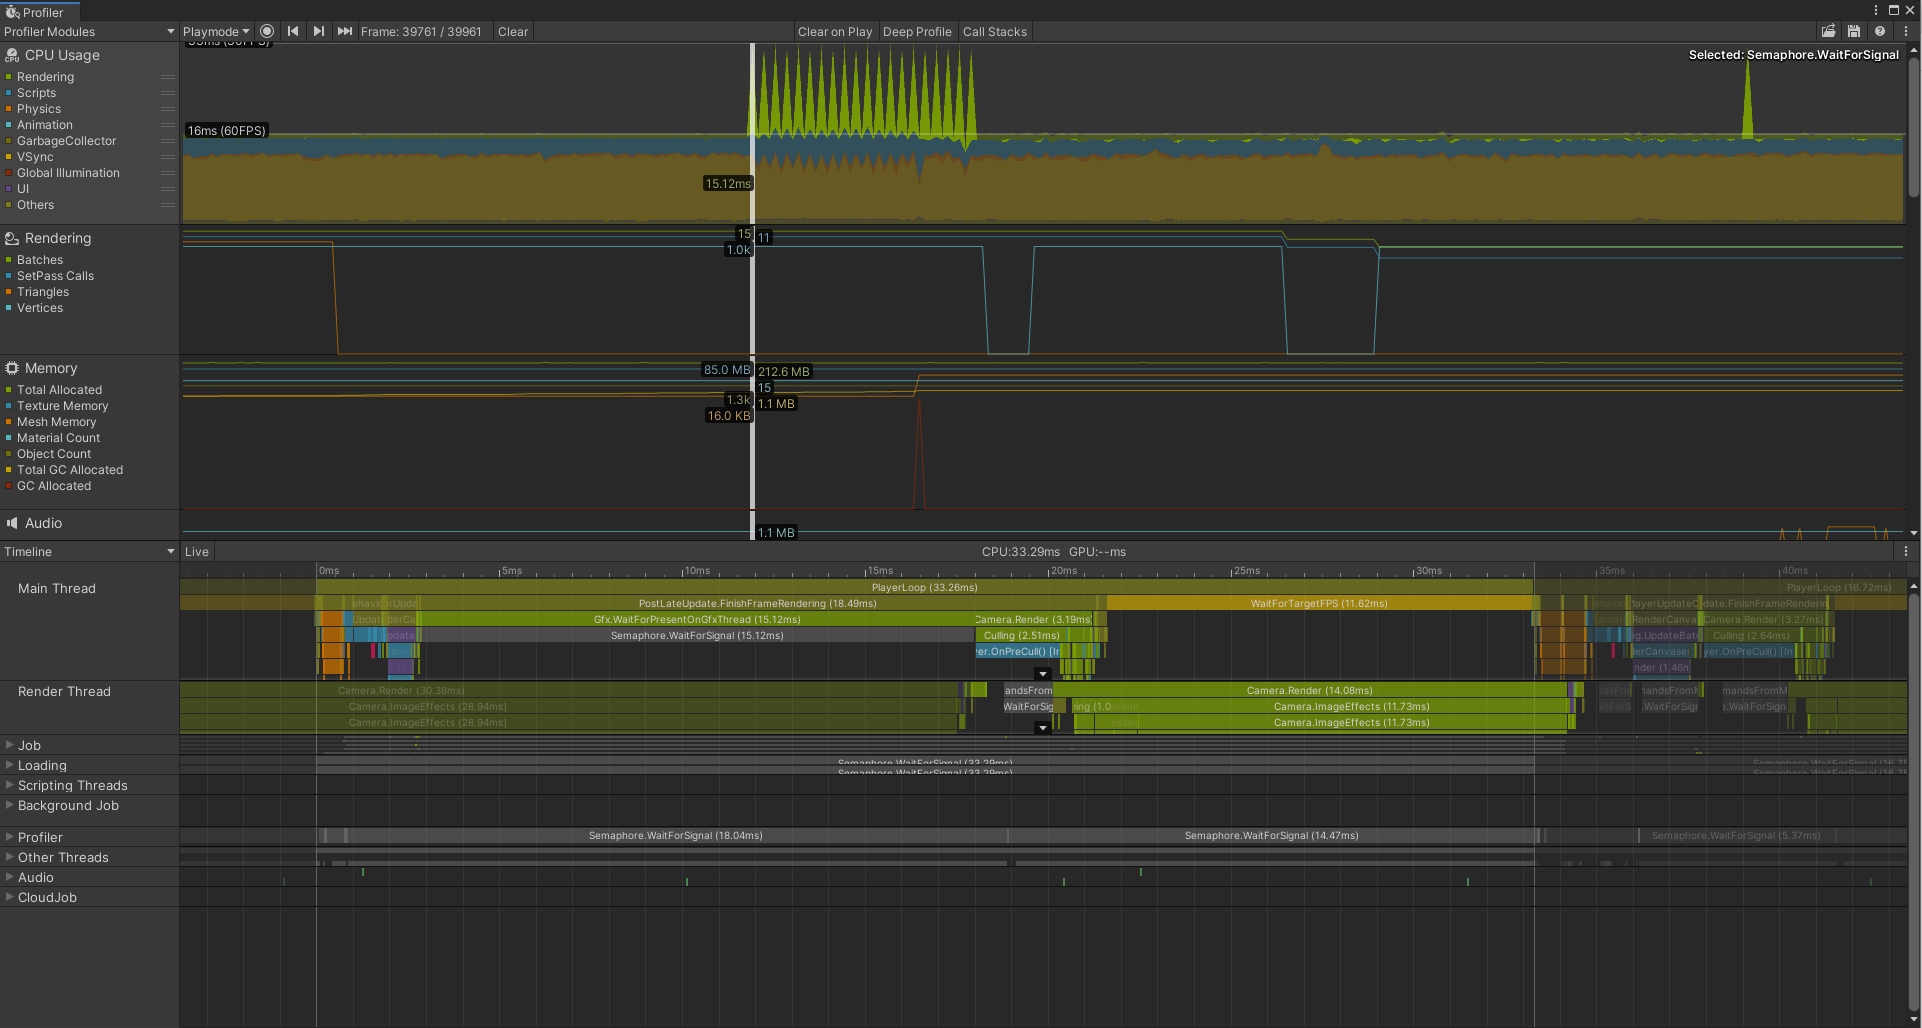
That semaphore means that the frame is waiting on the GPU - I would suggest enabling GPU profiling and see what's going on there.
I tried enabling the GPU profiler for my phone but since it uses $$anonymous$$etal it won't work. I also tried to get the problem to show up within the editor but couldn't.
The only alternative I saw was using the xcode GPU profiler but I don't have a mac to do it on. Any more ideas?
It turns out the issues was just something wrong with the IOS 14.4 Beta. The IOS 14.4 RC seems to have fixed the issue.
