What are "Dirty Scene Objects" in Animator.Update in the Profiler
In the profiler I am getting a large percentage for "Dirty Scene Objects" this falls under Animator.Update. What is this referring to?
Unity internally uses the dirty flag to find out when assets have changed and need to be saved to disk. You can read document here : http://docs.unity3d.com/ScriptReference/EditorUtility.SetDirty.html
So is this only being brought up as I'm profiling in the editor? I will do a build and see if I get the same results.
I still get these dirty scene objects in a build as well. So I'm not convinced it is the same thing as the editor setDirty you have referenced to. Any other ideas?
Maybe @RomainFailliot can shed some light on what DirtySceneObjects does? And how to best optimize it's usage?
We need to change the profiler marker name, code was moved around but look like we forgot to update the profiler marker name, it should be Animator.WriteProperties.
This code is executed from main thread and it does write all component properties: float, int, bool, and object reference like sprite. It does also send a transform change callback to update the whole transform hierarchy.
So either you have a lot of properties to write or your transform hierarchy is really big. One error that we saw a lot is some users have the bad habit to regroup ennemies under a single root transform, this is really bad as it prevent us to write all transforms in parallel, but I don't think this is your case because the WriteJobs marker would be a hot spot too and I don't see it in your capture.
So my guess is that you are writing a lot of properties.
Hi,
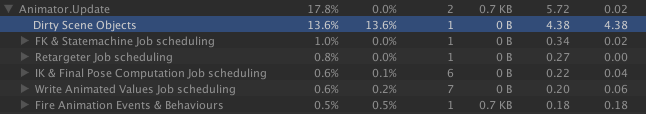
I'm experiencing a strange behavior in the profiler with Animator.DirtySceneObjects.
In our game I have 1 scene loaded, and as I check the Profiler on the Timeline view I can see that Animator.DirtySceneObjects takes us ~12ms on the main thread.
What is strange is that after I additively load 2 extra scenes and profile again, the same function takes a lot less time, ~0.12ms. I can't find an explanation for this behavior. I've attached below a link to 2 screenshots of profiling the 2 scenarios for reference.
Thanks
there is nothing that come to mind that could explain this behaviour.
If you are willing to log a bug report with your project exposing the issue we will investigate it.
