- Home /
Profiler Overhead 90%. What?
What is Overhead? How comes it takes entire 90% (5ms) from the profiler?
Is there way how to reduce this horrible number?
Will gladly give additional information if needed. I am targeting for PC so no mobile phones.
Vsync is turned Off. It gets me to 30fps.

Answer by Wrymnn · Jan 04, 2015 at 10:33 AM
The overhead is what editor Profiler and Unity Game engine eats up. Since u are not compiling your entire project to eg. .exe it takes up a lot and decreases fps maybe even 10x than it would normally do.
really Thank you you saved my day , i m really greatefull ^^
Answer by CHPedersen · Dec 16, 2014 at 10:31 AM
Other answers on the interwebz seem to suggest that it's caused by vsync, such as this one:
http://answers.unity3d.com/questions/482381/what-are-causes-of-overhead-in-profiler.html
Looks like it was answered by a Unity employee, so I guess it's safe to trust that. ;) If it's vsync you have nothing to worry about, it's just Unity waiting for the screen's refresh rate before it starts rendering the next frame.
You can typically disable it in your video card's driver settings if you want your game to run full-speed and not be locked at 60 FPS.
Heh okay, so there are 2 Vsyncs? One in Quality options which I have disabled and another one is caused by my VGA driver? lol :D $$anonymous$$inda bad design.
If this is true, those stupid 5ms will be there for every user that wants to play my game Ahhh cmooon, this is unbelievable.
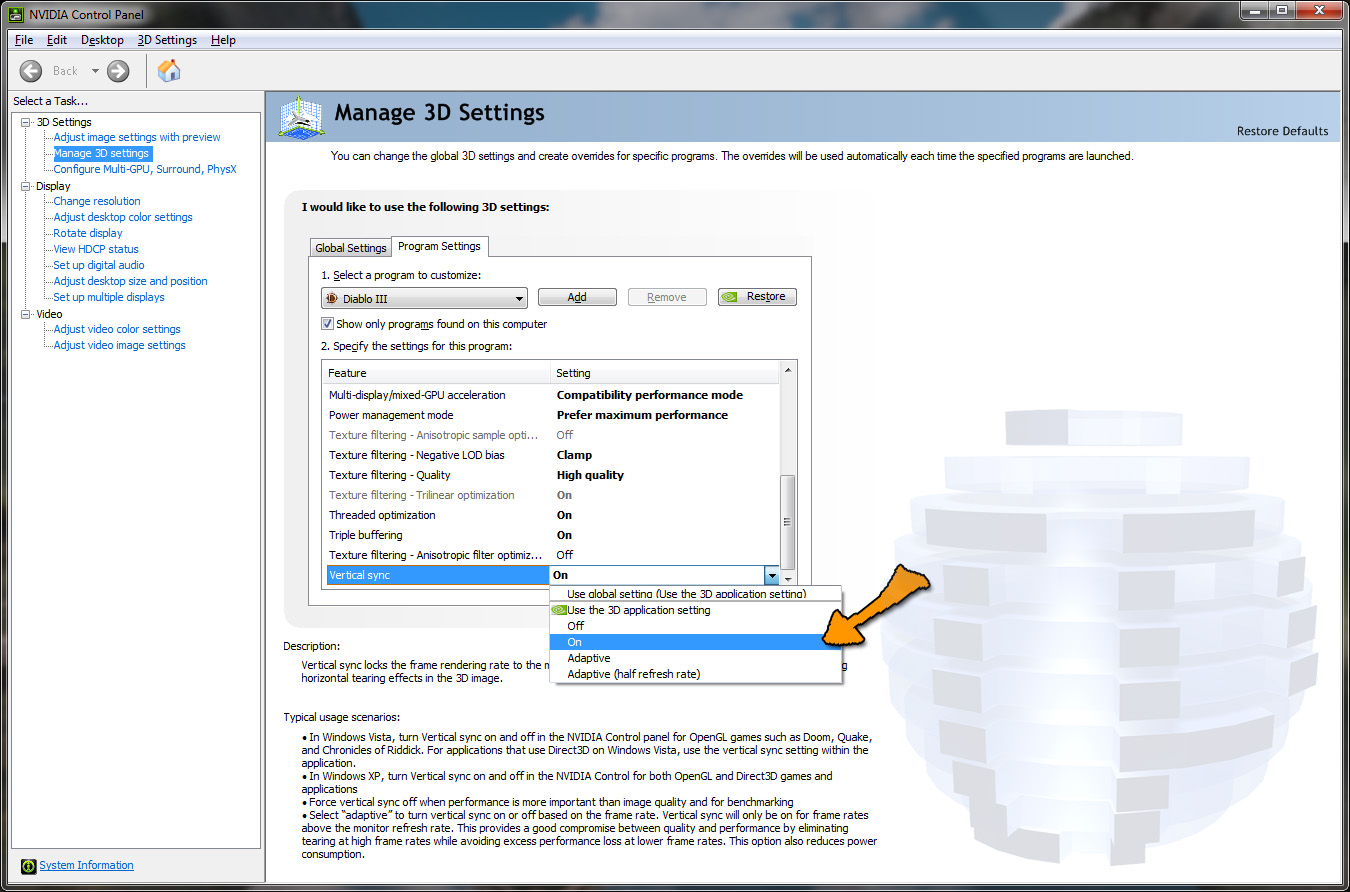
Of course there are! All VGA drivers can let applications control vsync. This is what that looks like in the NVidia Control Panel:

The Catalyst software for ATI cards have similar settings, and so do the 3D settings for the integrated Intel HD Graphics. When video card vendors provide the option to allow 3D applications to control vsync, then it implies the 3D applications have to actually have a setting inside of them for it, too. Unity is no exception. The video card drivers expose the setting in their control software because you might sometimes wish to override, or not honor what various applications might be requesting.
Besides, VSYNC is not a performance issue. It represents time where your video card is waiting for your screen because it renders frames faster than the monitor updates. Those 5 seconds will decrease and ultimately disappear as you add a greater workload for your GPU. Why would you want to render frames faster than the monitors refresh anyway? By far most PC monitors run at 60Hz.
If it's hovering around 30 FPS, it might still be caused by VSYNC, but set to Every Second VBlank ins$$anonymous$$d of every VBlank (or Adaptive (half refresh rate) as in the screenshot above). It would then target approximately 30 FPS.
If it is not, and you're sure VSYNC is completely turned off, then you should be seeing fluctuating framerates that vary wildly depending on what's currently being rendered.
As a re$$anonymous$$der, you should of course be testing this by connecting a stand-alone debug build to the Profiler. If not, the Overhead you're seeing can also be caused by the Editor and Profiler itself, as the Editor is itself a 3D application, with its own performance demands.
One thing I can tell you for perfectly sure: Unity did not add an arbitrary 12 second delay for no reason. :)
Sure, that might very well be the case. Especially the scene view can struggle sometimes with large amounts of objects, because it's not just rendering the objects, but also all the gizmos and mesh wireframes, collider wireframes, etc.
PS: Is it me or is Unity Answers sorting our comments kind of weird?
Negative. The editor runs all user code in the same process, so when you use the profiler in the editor, what you see will always be a mashup of your own code's performance and the editor's, including memory usage. Closing the scene view could help, but the editor does many other things. The profiler itself can be pretty expensive. For example, one of the things people constantly get confused about is the presence of RenderTexture.SetActive in their GPU profiler readings. They claim it's wrong because their game doesn't use RenderTextures, and don't realize the RenderTextures are actually the 3D views of Unity's own editor windows.
For realistic readings, one should always profile stand-alone builds, and maybe even running on a different machine (connected with the Active Profiler->Enter IP option).
Your answer

Follow this Question
Related Questions
How do I fix an Overhead Issue? 3 Answers
Profiler, What does "Overhead" represent? 1 Answer
Unity 5.0 Increased overhead (Editor) 0 Answers
Windows Phone 8 Overhead - Crawling 2 Answers
What is this overhead? 1 Answer
