This question was
closed Feb 09, 2016 at 08:57 AM by
Andreas B for the following reason:
The question is answered, right answer was accepted
Profiling issue: Can see the RaM go up but when taking a detailed snapshot of the memory I cannot find any leaked memory.
Hello. I have been profiling a game due to a memory leak and I can see the memory going up(leaking memory) when in the unity profiler when looking at the memory in the simple view 
But when I later take a snapshot for detailed information about the objects the memory displayed looks like this 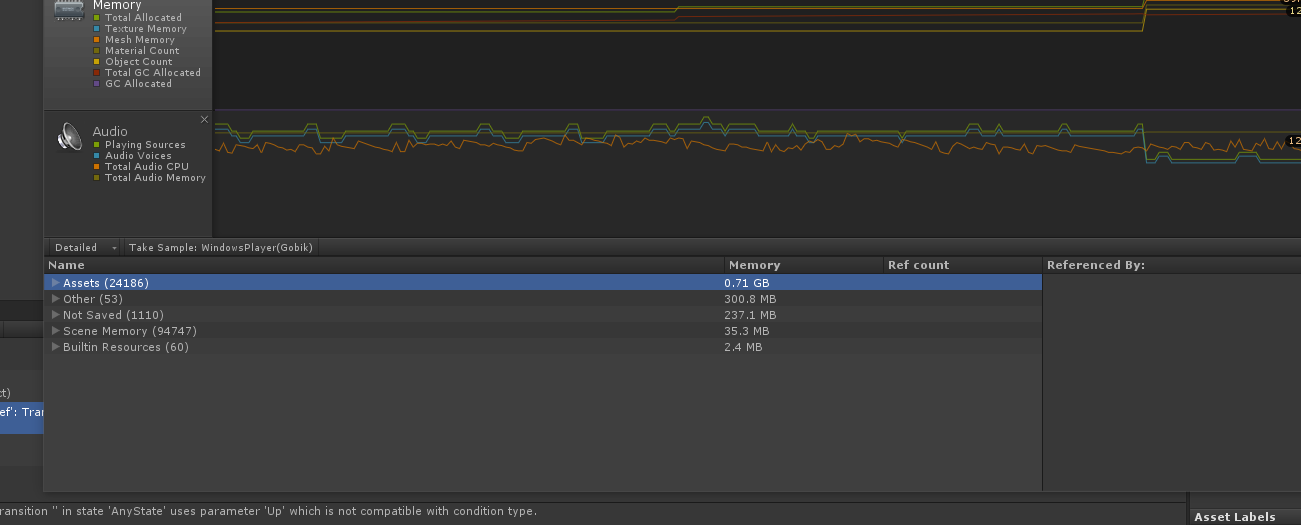 So when I let the game keep running the memory on the first image will grow but the detailed view always stays the same after new samples.
Anyone have any ideas how to handle profiling a memory issue like this if the Unity Profiler does not seem to do it?
Best Answer
It seems like the unity version I had was leaking memory from shadows, updating unity solved this issue.