How to take mono heap dump from unity3d?
Is it possible to take heap dump for the managed (mono) objects?
Obs.: I am not talking about native heap dumps.
A similar feature is available in java and other languages.
For instance with java there are programs to perform offline analysis of the java heap, allowing to count application objects, navigate on the object tree, etc.
Do unity3d or mono have a similar feature?
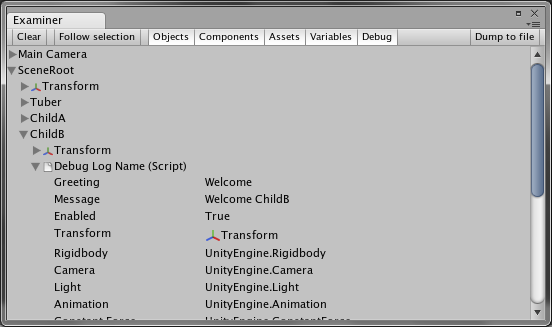
Note that if you want to dump information about all the objects in your scene, you don't need to delve into the bowels of the .NET heap, you can simply traverse the scene and dump information about the objects it contains. This is not the same as a heap dump, but is still a very useful debugging tool.
This script demonstrates how to dump information about all the objects and components in the scene. Works for Unity 2.6 and 3.1, and is not dependent on the debugger.
For a more full-featured version of this script, including a new editor window with System.Reflection-based scene exploration, see http://zeroandone.ca/unity.
Unity doesn't offer any such functionality.
Can't comment on mono 1.2.5, but I can say that there is not even support for debugging in it, so that might give indications.
Although debugging support has been announced for Unity 3, so he might get that capability come summer.
I will not mark this question as answered until a few week after the 3.0 release...
Hi $$anonymous$$, the 3.0 release has come and gone -- did you find any other info elsewhere you can share, or are my suggestions of any use for your situation?
Unity 3.1 doesn't offer heap dump support either, though debugging is now possible, with MonoDevelop, the Mono IDE.
Mono itself does have a profiler, which includes the ability to log and analyze object allocations. Currently it runs only from the command line, though there are plans to integrate it with MonoDevelop.
I wondered if I could use the command line profiler in the Unity environment. I downloaded Mono 2.8.1 (the latest stable release), and attempted to run "mono --profile=log unity.exe", but this only works for .NET applications, which unity.exe is not. Worse than that, installing Mono 2.8.1 messed up the MonoDevelop environment integrated with Unity 3.1. At this point I gave up, maybe someone else has tried harder and had more luck?
So for the time being at least, it looks as though we're still out of luck. The good news is that graphical profiling tools are in the works for MonoDevelop and hopefully we can expect to benefit from them in a future Unity release.
