Unity Mobile: Profiler
Hello,
I set up Profiler in order to optimize my game for mobile game, but I can't seem to be able to figure out how to efficiently use this tool. I've read through the section on the manual that covers profiler (https://docs.unity3d.com/Documentation/Manual/ProfilerWindow.html), but it seems to me that it goes over how to use the profiler assuming that I know what all of this means.
I understand that it will be impossible to cover everything here, so I am asking if there is a guide that I can follow that will help me answer following questions:
What are the important variables to focus on, and how do I improve them?
What are the acceptable values for those variables for mobile devices?
How do I compare performance improvement from one build to another using the profiler?
For example:
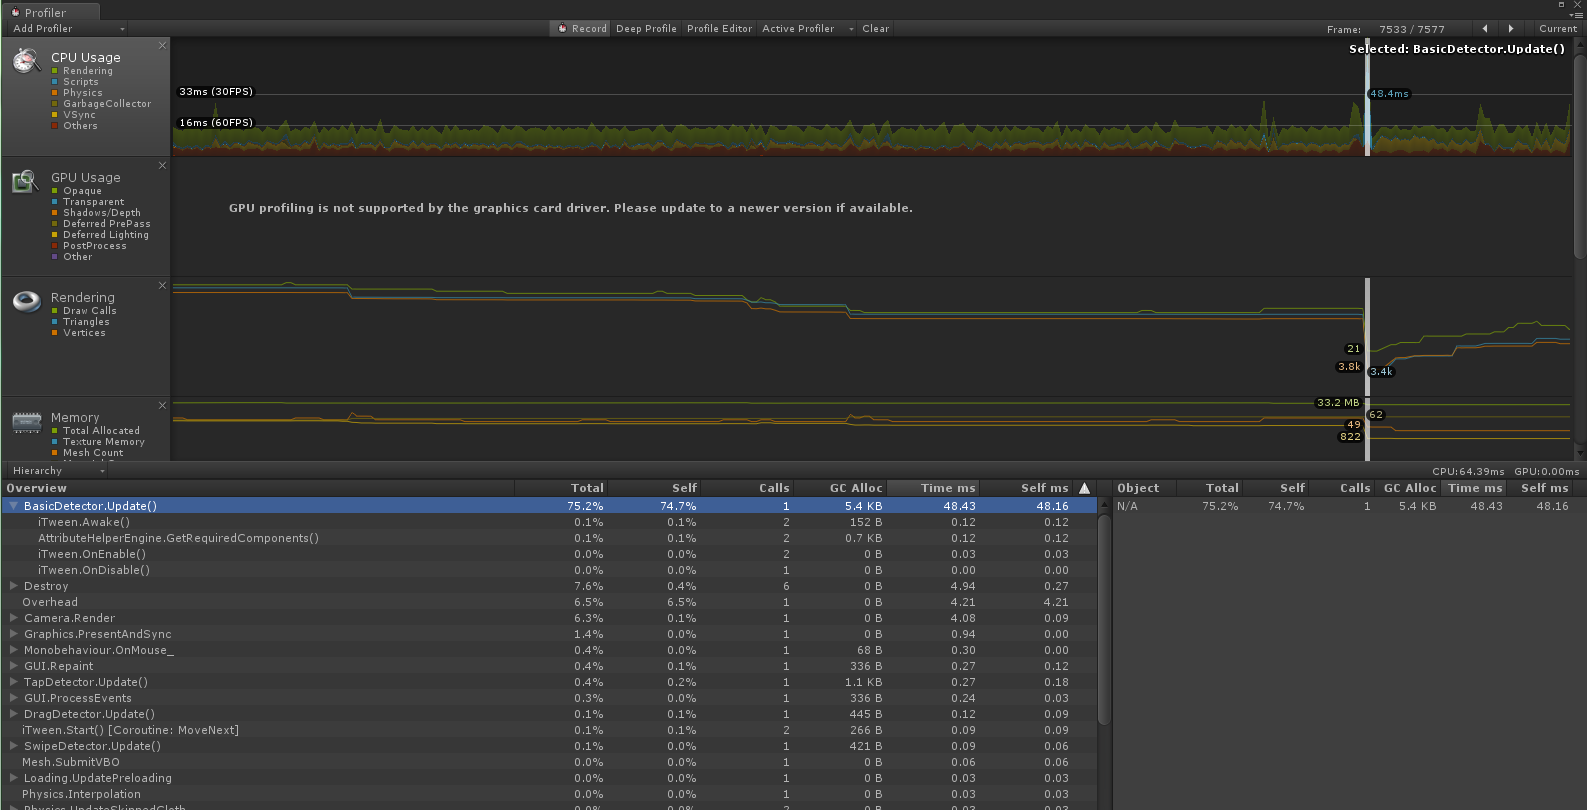
Okay, I understand that BasicDetector.Update() is using way too much CPU power(?). But where do I go from there? What does it mean when I see methods from other scripts under this particular method? etc...
If there isn't a definitive guide that covers these topics, what are the steps I need to make in order to better understand how to use the profiler?
Thanks!
Optimization of your application is usually different for every application. You should read this guide on optimization for Mobiles in order to better understand what areas to look at. You can compare performance improvement by looking at total time taken each frame. If you take less time per frame on a new build, you have improved.
https://docs.unity3d.com/Documentation/Manual/iphone-PracticalGuide.html
