Memory usage in xcode does not equal to the number in unity profiler
Hi all,
I have tested my game on ios, and see the profile data from both the xcode and unity profiler (connected to my iphone, not in editor).
I did a test: switching between two scenes (with NGUI) repeatedly, and watch for the memory profiling at a specific position.
unity profiler tells me that the memory usage is not changed a lot (As I expected).
However, the memory in xcode keeps rising (not every time, but definitely increased by tens of MBs), and finally this app is killed by IOS (memory alerting).
The following are two screenshots from my profiling:
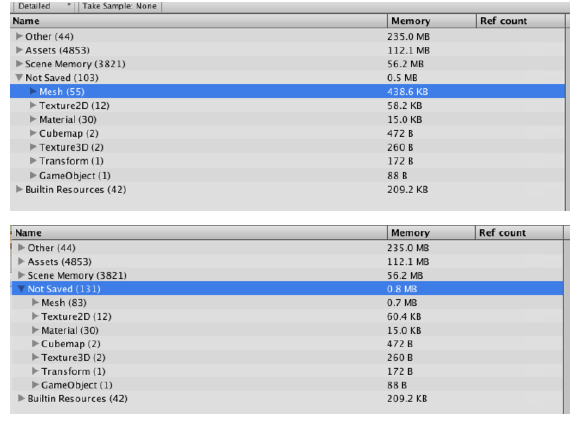
We can see, the only difference is the 'Not saved' term and it's only 0.3M difference. But the memory in xcode is about 30M diff. I believe the memory number in xcode is the right one (since it's do killed by IOS).
I have a couple of question:
Why there is a large different between unity and xcode memory data?
Why the memory usage keeps increasnig in my case?
What's the 'Not saved' section stand for, is it the reason of the memory increasing?
BTW, I have search for 'Not saved' section in unity and see this. It seems NGUI has some issues with it, but it should be fixed (my NGUI version is 3.8.1). Yeah, my unity profiler didn't show the 'not saved' has a lot of memory usage.
Thanks a lot!
