How to display profiling data on screen (Android)
Hi there,
I was wondering if its possible and if it is how to display Profiled data such as CPU Usage, FPS, Frame time, Draw Calls, Texture Count and Texture Memory via GUI Text or something similar.
I've managed to set up FPS easily however real FrameTime (before Vertical Sync) is proving difficult to access aswell as the others.
Thanks in advance for the help :)
I thought this would be a common thing that people do i'm really surprised I haven't got any replies yet :S
Do you have Unity Pro? It comes with a built in profiler. Do you need the profiling data on the screen? Drawing that information would actually skew your profiling results, much like the running the editor skews profiling.
Here is another question similar to yours. Sounds like you are able to access those same stats, but only from within the editor.
I do have Unity Pro yes, I require the profiler to be shown on screen.
Even so it is important that people viewing my game can have the ability to see these stats.
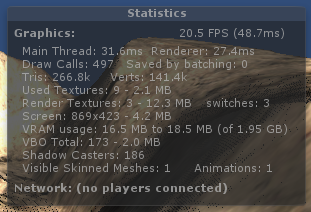
Damn it, the stats window you get in the editor is exactly what I need but I need it running on the release build. :(
Why would people playing your game need to see any of these stats? Those stats are really for development and debugging. I dont really see how they would help enhance the gameplay for your users
This seems to be a bit of a personal and irrelevent question
I work for a company that sells IPs. To sell these IPs and maintain investors I have to create demos using my company's IPs to convince investors and future partners why they should.
I'm attempting to create a Demo (not a game, but If i tell people i'm creating a demo they probably wont have any idea what im talking about)
I need to display this information to express how the hardware is handling the processes on screen.
I hope that answers your question although I feel like I didn't need to tell you any of that really
So it depends on what all information you want for each of this information you have to use different methods; I already this in past and it helps in checking out build performance on device.
For FPS you can use these scripts:- http://wiki.unity3d.com/index.php?title=FramesPerSecond
For monitor memory usage usage:- getruntimememorySize(object) getmonoheapsize getMonoUsedSize
you can google these function, and you can display this on screen using GUItext or anything you feel comfortable with. hope this helps? Thanks
Those three methods seems to be about memory occupation not CPU usage. You can have plenty of free space but a processor running snail speed.
So unity does not let you see those information because it seems it won't allow you to use the PerformanceCounter class, even though it shows up on Intelisense (or I am doing wrong).
You could have a secondary program though, like a basic opengl or VS Form application on which you display diagram based on values fetched from the PerformanceCounter class.
http://msdn.microsoft.com/en-us/library/w8f5kw2e.aspx
You open the side application looking there:
http://answers.unity3d.com/questions/139203/open-a-external-program.html
EDIT: So it seems you can get the Performance Counter with Unity, see here http://answers.unity3d.com/questions/506736/measure-cpu-and-memory-load-in-code.html
This is okay but I'd like to see what other people have to say :)
Has anyone else got an answer for this? I know this can't be the case. I can retrieve the profiling data via logcat, I just want to know how to access it via script :(
Thanks for the link, can't get it working just yet but I'll ask around on this thread :)
