- Home /
Memory in Profiler not correct with Empty scene
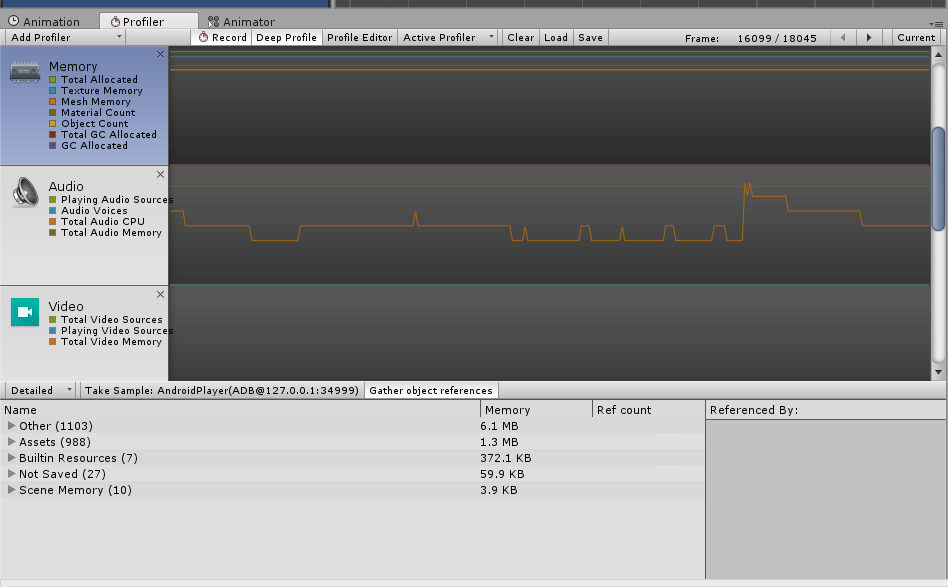
I don't understand which is the REAL SIZE in RAM of my app. I am using a development build on an Android device. I click on memory. This is a build with only an empty scene. I click on memory and I see approximately 8 Mb allocated.
Then I go on my android device, I launch the app, then I click the Home button and I go to the App settings, and in the CACHED PROCESS my app takes 60 MB !!!
How IS this possible? How can I see what is responsible for these 60 mb with an EMPTY SCENE ?

Answer by TheMannyzaur · Sep 05, 2017 at 06:17 PM
Do you have other scenes created? If yes did you open them? If yes then that is the reason why the profiler is still that way. The profiler doesn't clear after a scene has stopped playing (in mine that is) so that must be it
Your answer

Follow this Question
Related Questions
Bug? CUBE map using a LOT of memory 1 Answer
Memory Leak Help 2 Answers
Performance going down over time 2 Answers
