System.ExecutableAndDlls - Very large memory consumption
Hello Community,
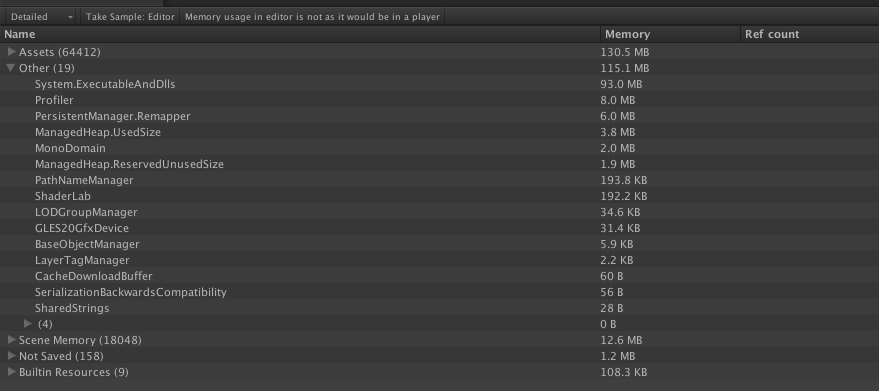
We are suffering with large memory consumption in our game and we found in the profiler process called System.ExecutableAndDlls that takes 93.0 MB - what is it?
We've get this info from the profiler connected to the iPhone 4S so it is real memory consumption. We need make work our game on iPod touch 4 (256MB RAM - available maximum 130-140 MB). Now it takes 230MB in game. Assets take 130 MB and "Other" takes 113 MB. We can make all in-game assets take about 70-80 MB, but we don't know what to do with "Other" -> "System.ExecutableAndDlls".
We've tested that pure Unity on iOS consumes about 25MB (it's ok).
Also we use in the game this plugs: Prime31 - Flurry Prime31 - Social Networking Prime31 - In-App Purchase Prime31 - Etcetera NGUI NDATA Simple SQL
Name: Screen Shot 2013-08-15 at 17.59.48.png Views: 18 Size: 47.2 KB
We've created an empty project ant it consumes 25-27MB. After that we've tried to add all this plugins to the empty project and make them work and the memory consumption rised to 35MB - it is still much less than what you can see on the screenshot.
We use Unity 4.2
Thank you in advance!
I am facing the same problem, it goes to 180 $$anonymous$$B please help
I have currently got 133$$anonymous$$B for System.ExecutableAndDlls on our game on Unity 4.3.3b1... I cannot see why anything should eat up such an enormous amount of memory on iOS? This is way more than all our textures, audio, animations and other things put together.
Cheers, Christian Tellefsen CTO $$anonymous$$egapop Games
Memory reported under "System.ExecutableAndDlls" is read-only memory, therefore OS might discard these pages at need and later reload from the file system. So it makes little memory pressure and it rarely directly contributes to OS decision to kill application. Also some of these pages might be shared with other application (which are using the same frameworks). Of course it's still good idea to keep it smaller (for faster startup times) and you can do it by enabling managed code stripping in Player Settings.
It's the main executable with all scripts and script DLLs included. Have you tried enabling Stripping in the Player Settings (you should find it under the Optimization category)?
Check out "Optimizing the Size of the Built iOS Player" page in the documentation: http://docs.unity3d.com/Documentation/Manual/iphone-playerSizeOptimization.html
"Strip Assemblies" in player build settings. Dropped my System.ExecutableAndDlls from 92 to 53mb in an empty project with a few plugins.
The memory reported under "System.ExecutableAndDlls" is read-only memory and this means that the application cannot change it or write it, but its main role is to accelerate the execution of the application. And because it is read-only pages OS might discard these pages at need (if there is not enough free memory pages) and later (when needed) reload from the storage. So it does not make a big memory pressure and it rarely directly contributes to OS decision to kill application (because OS can discard it in any time). Also try to calculate game's memory usage outside the profiler, in my game System.ExecuteableAndDlls was taking 80 mb, but in windows tasks manager it only used 45 mb.
