Memory Profiler - Understanding the numbers
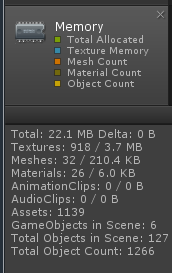
So I'm looking at some numbers for the default empty scene containing only a camera ("Main Camera") and see the following in the profiler:
My questions are:
Under Textures, what does the number 918 mean?
Why does an empty scene have 32 Meshes, 26 Materials, etc...?
Okay, I converted to an answer.
I suspect you're profiling within the editor and seeing the editor resources as well as game resources.
I ran a dev build outside the editor and the numbers collapsed somewhat:
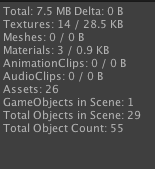
You're right, I was in the editor but I connected to an outside of editor deployed build and got numbers that made sense (like your example). Thanks!
I met similar situation
http://forum.unity3d.com/threads/175585-Profiler-bug-(Texture)?p=1200861
It is 3.6MB
What grab the memory? for OnGUI? I don't use OnGUI so I want release the memory
As I've already pointed out. If you profile within the editor you will see resources the editor is using as well.
And this includes the new "Detailed View" snapshot - you have to run it on the device or it can be wildly higher. You can try to make it more accurate by using EditorUtility.UnloadUnusedAssets with a bit of editor script. Otherwise it will include assets from multiple scenes + the editor stuff.
