First time a method is executed is ~4 times slower
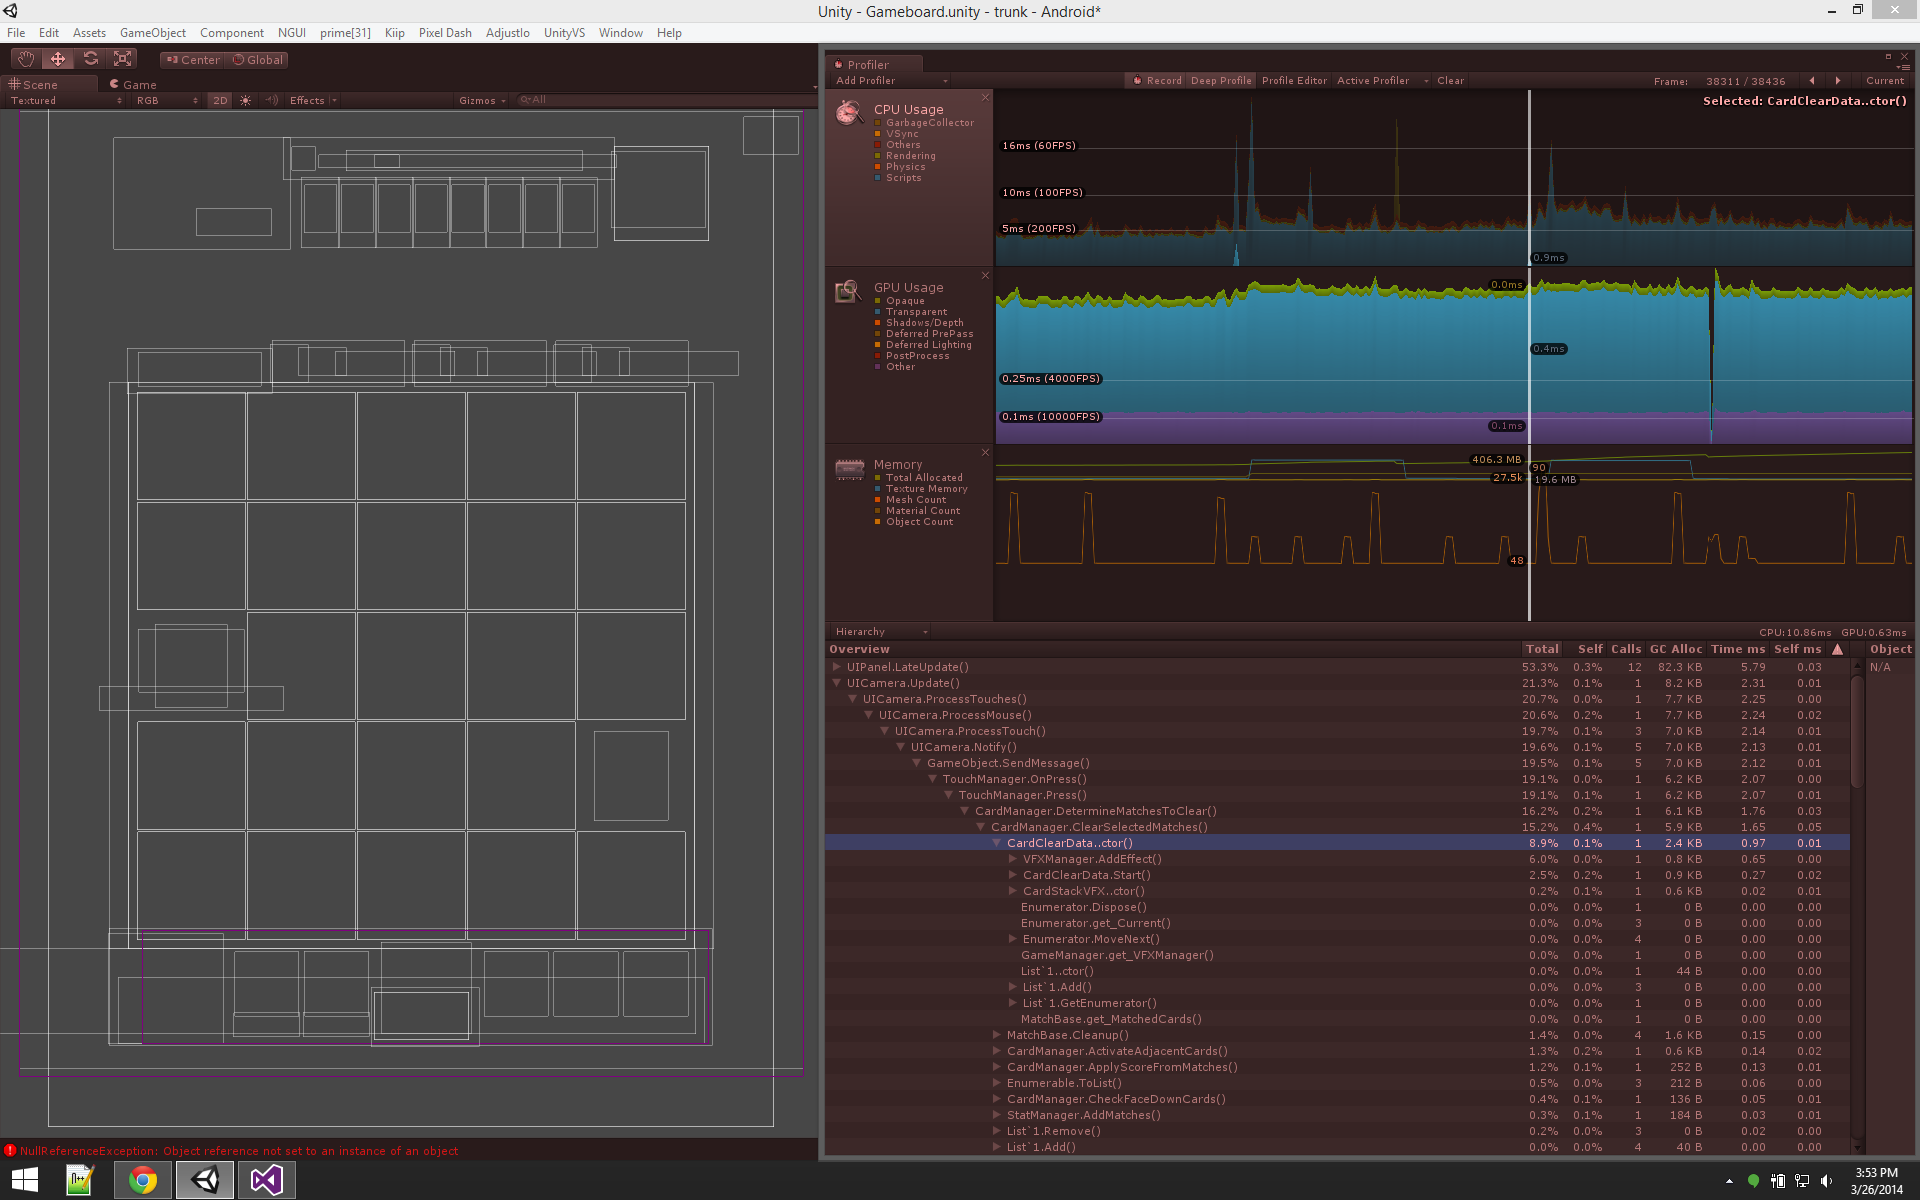
I've noticed a strange issue with the game I'm working on. It's sort of a match-3 style game and the first time the player clears a match from the board, there's a huge performance hiccup. I'm in the process of trying to find the source. According to the profiler, the first time most methods are called, they take about 4 times longer to execute than subsequent calls. For example, the constructor of a fairly simple class CardClearData takes 3.21 ms the first time one is created. The second time it takes 0.97 ms. This class has no static constructor that is getting called in the background and does not inherit from any other classes.
Is there some sort of magic being done under the hood by Unity? Some sort of caching or optimization? It's been extremely hard to track this down because it doesn't come from any one method or object. Across the entire hierarchy reported by the profiler essentially every function call takes longer the first time. As far as I can tell, this is something fundamental to either Unity or C# that I don't know about.
Here is what I know so far:
It doesn't seem to be from texture loading, as far as I can tell. I'm not seeing any texture loading entries in the profiler. I'm also using the two big 2048 textures before this happens and there's only a couple of smaller 512ish textures that might be getting loaded.
There's not any caching or object initialization going on the first time. All of that sort of setup is done before entering the game.
No GameObjects are being created. They're just activated from a pool of inactive objects.
I'm seeing the issue on regular objects created purely in C#, not just GameObjects.
Here are a couple pics to illustrate the issue.

Did you ever work out why this was happening? I guess Unity is allocating resources and recycling them after the initial execution?
Is the method calling some static members or static methods? Those are created on first call so that would explain why it gets slower. Also, the used variables may not be cached until first call so you get some cache miss that needs to be resolved, later calls do not have those cache misses since the variables are still in the cache memory.
@poolts, Unfortunately, no, I did not find the root cause. I found out the majority of the performance issues I was seeing was from the GPU loading textures for the first time (it was only a problem on mobile which is why I didn't immediately find the problem. Turns out, mobile devices are really slow at loading textures). Once I fixed that problem, this because a much lower priority.
@fafase, Not in my code, but in the .Net calls, yes. I tried to rule that out as much as I could. I initialized my lists to be the correct size so I know it was wasn't growing. I made sure there was no additional memory allocations in the first call. $$anonymous$$oving code into cache memory is actually what I'm leaning towards at the moment. $$anonymous$$ain memory is still really fast, tens of nanoseconds, so it'd have to be doing a lot of accesses to add up to the time I'm seeing, but it's possible. I don't have a better idea right now.

.png)
.png)