GPU Profiler of stand-alone app is chopped off
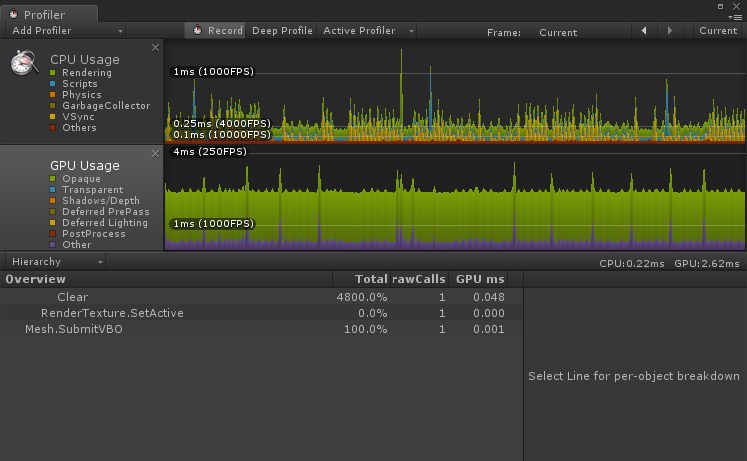
Within the past couple of days, when I try to profile external apps, the GPU section looks like it has its top chopped off, and reports questionable numbers:
 Overview                        Total  DrawCalls   GPU ms
        Clear                  4800.0%          1    0.048
      RenderTexture.SetActive     0.0%          1    0.000
    Mesh.SubmitVBO              100.0%          1    0.001
This did not used to happen. I recently installed 3.5.3 on top of 3.5.2, but I have done the same at home without this issue, and others in the office can correctly profile the apps that are failing on my work machine.
Any ideas?
