- Home /
Why is there so much GC allocation with GameObject.Activate and Physics2D.SendTriggerContactCallbacks on iOS?
I am profiling my iOS game that has stuttering every 2-5 seconds of moving objects. I am guessing this is likely due to a drop in frame rate and have started profiling.
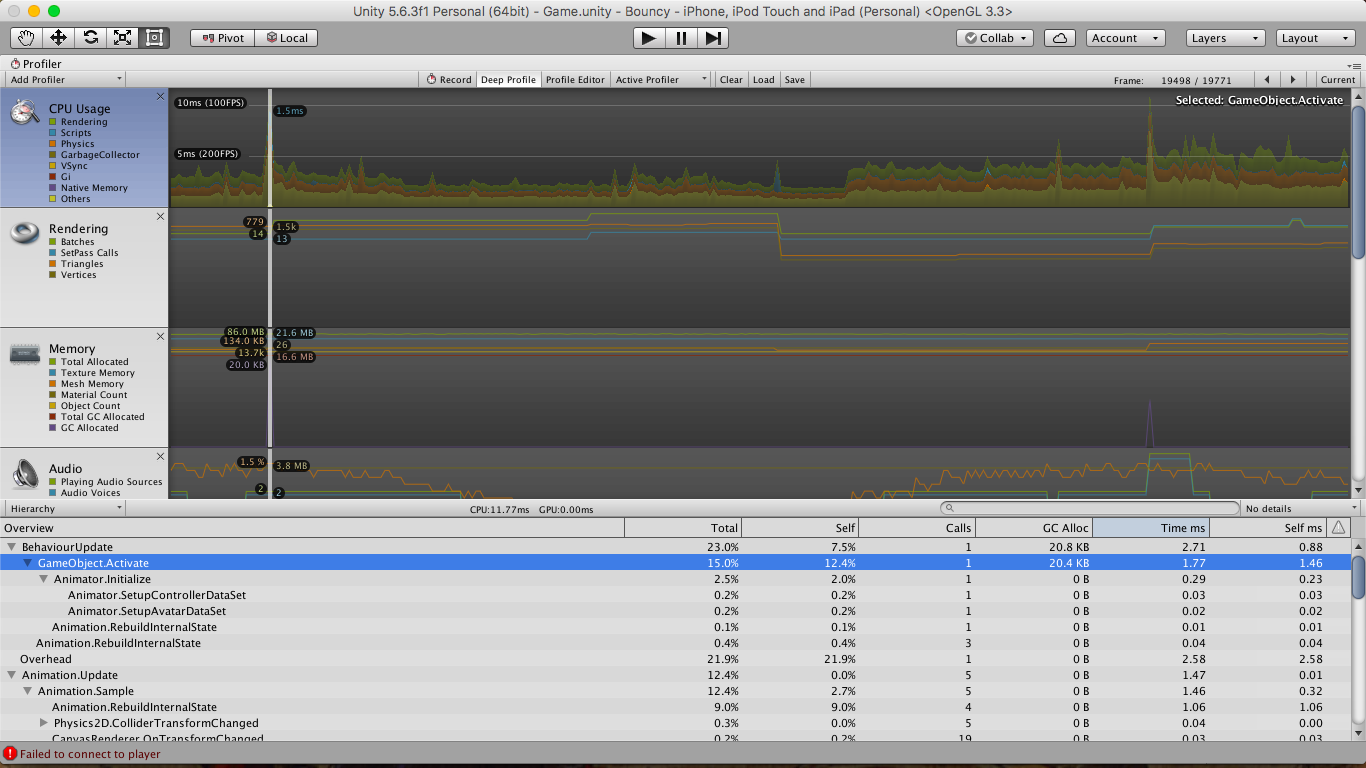
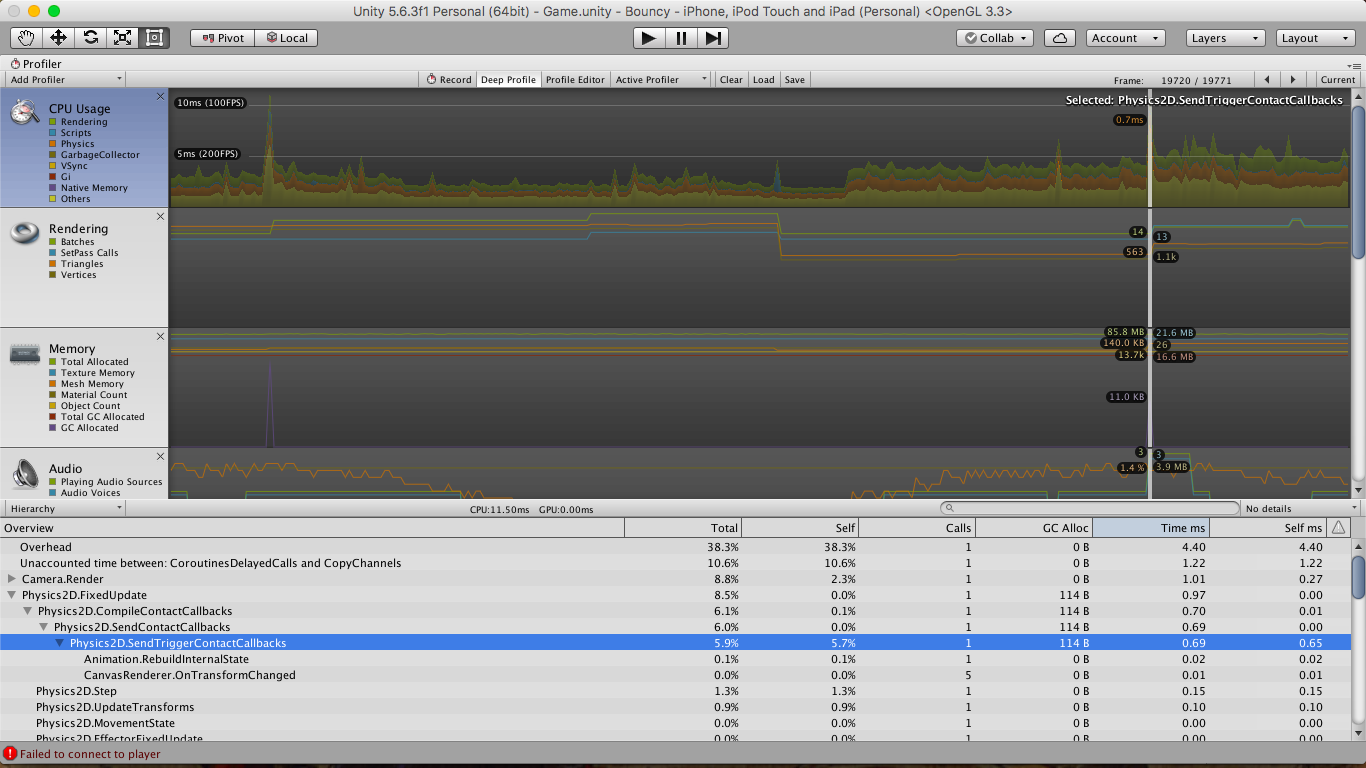
Here are some screenshots of spikes with GC allocation. How do I figure out which GameObject/Script is causing these issues?
Also, why do I not see VSync on iOS (it should be at 60fps)?


Answer by Bunny83 · Aug 24, 2017 at 03:28 AM
Well activating / deactivating gameobject can be quite demanding. However it depends on what kind of object it is or specifically which components are involved. Physics objects (rigdbodies, colliders, ...) need to be added / removed to / from the physics system.
SendTriggerContactCallbacks may depend on what physics callbacks your scripts implement and how many actually receiving a callback. Also keep in mind when you don't need the callback parameter you should omit the parameter as this would avoid the creation of the collision / contact information.
I don't quite get what you mean that you "do I not see VSync on iOS".
Are you actually testing on the device using the remote profiler, or do you test in the editor?
Thanks for the quick reply. So the GameObject that was disabled in my first screenshot is likely causing a lot of GC allocation (20.4$$anonymous$$b) due to the components that are attached to it?
By omitting the parameter do you mean not including "Collision2D other" in: void OnCollisionEnter2D (Collision2D other) { } or is there some other option, as I don't include this if I don't use it?
I have made a build on my iOS device and it automatically links the profiler when I launch the game, so I am assu$$anonymous$$g I am testing on the device, or is there some other process there? By not seeing VSync I mean why don't I see the VSync in the profiler (capping the framerate at 60fps)? Also, I am confused as to why I am seeing stuttering on the device when the profiler says that the frame rate does not go below ~100fps, which I would assume should be capped at 60fps, as I have set Application.targetFrameRate = 60; in awake.
Your answer

Follow this Question
Related Questions
UpdateDepthNormalsTexture 0 Answers
AssetBundle memory profiling 0 Answers
iOS profiling help 0 Answers
iOS framerate drops every 10 seconds or so... 1 Answer
Framerate drops to 40, profile says 60% in 'Overhead' 0 Answers
