- Home /
What could be causing my super low performance on my Android tablet?
On my Android phone I don't have any performance issues, but on my tablet, a lenovo a10-70f, it's horrible. I tried with a nexus tablet, and again, performance issue. I have the issue with both 5.1.3 and 5.2.2.
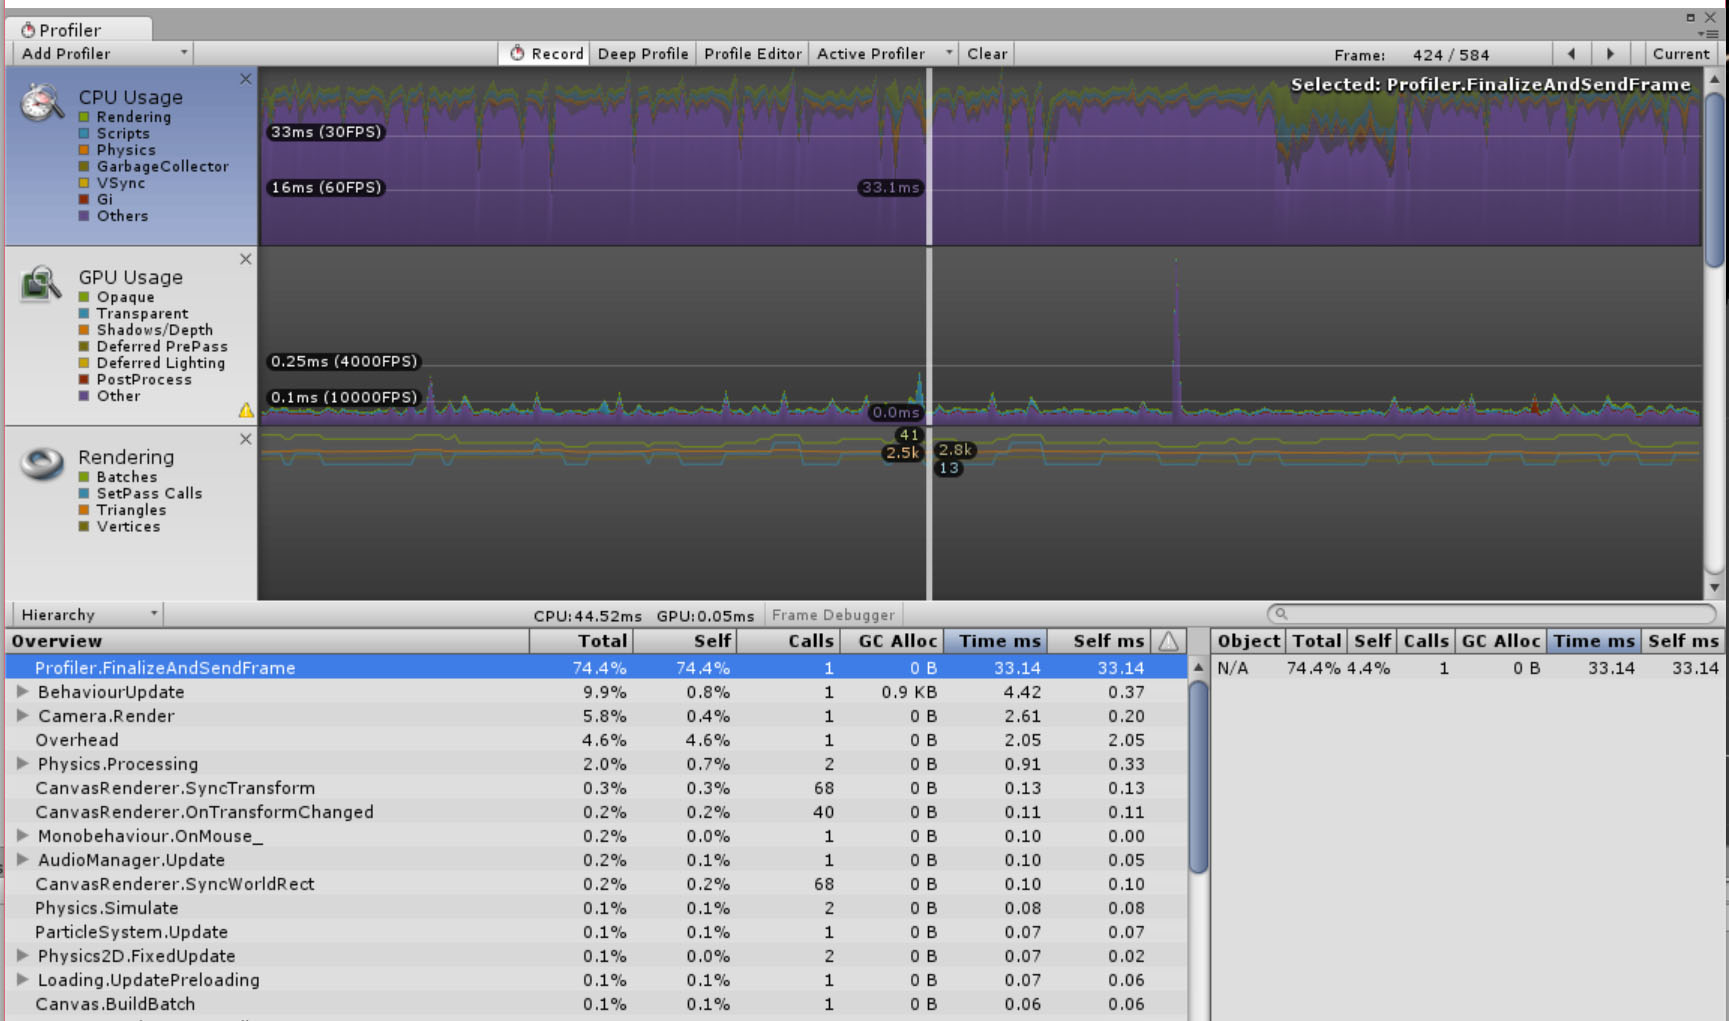
My scene has quite a few world space canvases, but other than that, I can't think of what could be the issue. If you take a look at the profiler, you see a performance hit, being the "profiler.finalizeandsendframe". But when I turn off development build, I have a just as horrible performance. When I open an extra menu, the performance drops even harder. So it seems a canvas problem, but the profiler doesn't show canvas issues.
Any idea what could be the issue here?

hmm I can't turn that on for externally connected android devices, right? All searches seem to point out that it's only possible within the editor of unity, but i'm testing on a device.
I have this problem too on PC, but not on this scale and it is intermittent. I just tried the Deep Profile. And it doesn't seem to give any more information about this mysterious call... Ill watch it live and try to figure out when it spikes.
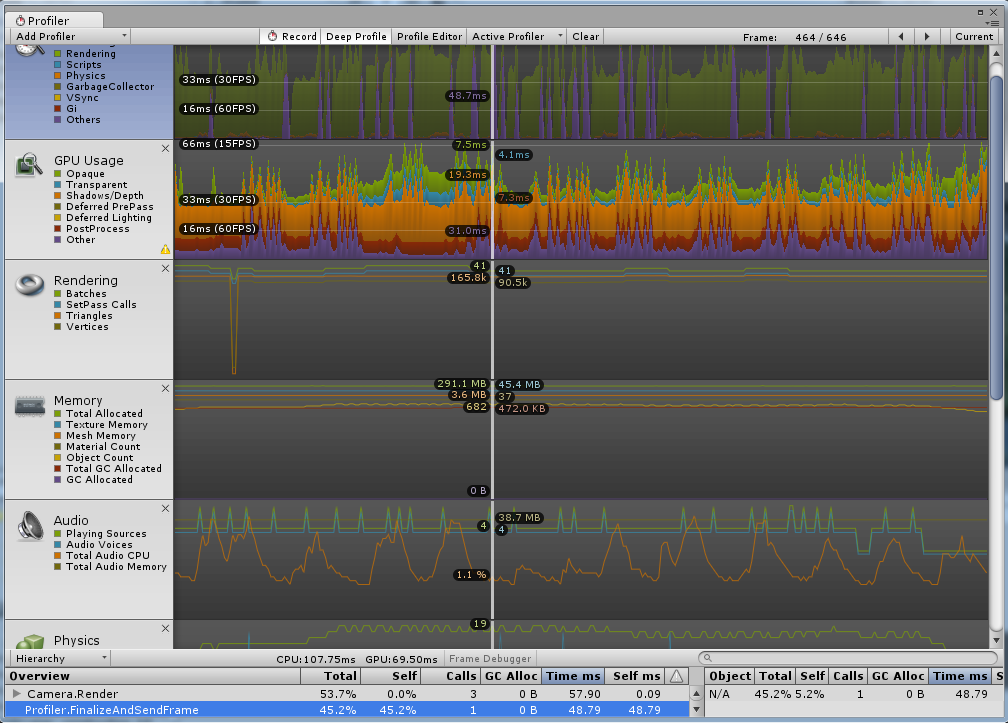
Edit: It appears to loosely follow a looping audio that I have, but it doesn't really match up with anything. Here is the data for my program, I hope it can help us figure out exactly what this is and how we can $$anonymous$$imize it.

Click 'GPU Usage' and see whats going on there too. Does this happen with VSync on?
If you're unsure if the gui is the cause, then try making a build with the gui disabled. At least this way you'll know for sure and help narrow down the problem.
ye, sorry forgot to mention: I did that. Still had quite equally bad performance! Perhaps on average a frame or 2 more per second.
Check Draw calls,FPs.If possible mark objects which are static as "Static" and enable static and dynamic batching in "other settings" which will be "under player settings". Hope this may help you. Nsks.
Answer by DaDonik · Nov 22, 2015 at 09:46 AM
You have to use forward rendering on mobile devices. I had the same slowdown problems, also only on some devices...turned out that deferred rendering was the problem.
Interesting! Well I checked my settings and it was already on forward. And switching to deferred made the performance worse. So unfortunately this is not my issue.
Answer by Arju2011 · Nov 23, 2015 at 12:55 PM
I think I figured it out! It's the profiler itself! Close all of those threads except for the "CPU Usage" one and collect new data on it. Then post your screen, I would like to see how much it changes your graph.
Ok! I will try that in a few hours when I'm home. Although I doubt that is the issue, because if I make a non-developer build for my tablet, my FPS counter still shows the same bad performance.
$$anonymous$$y Android Note 3 performs at 60FPS btw, although after a few seconds it van drop to pretty much exactly 30 fps for some reason...
Besides, do the threads actually close on mobile when I remove certain ones from the profiler? I thought that when you make a developer build, all stats get send over anyway? I hope I'm wrong :) I'll see later, thanks again
Answer by outasync · Feb 27, 2016 at 10:36 PM
The profiler can reduce the FPS slightly but for Android builds with Unity 5 you need to untick Auto Graphics API and make sure you only use OpenGLS 2.0, you can find this option in the Player Settings -> Select Android Tab -> Other Settings
Your answer

