Intermittent unexplained frame rate drops due to Gfx.WaitForPresentOnGfxThread and Semaphore.WaitForSignal. Can someone help me understand what is going on?
I have been trying to create a simple roll-a-ball style game for Android. I keep on running into an issue where my game randomly drops a few frames intermittently. I have optimized rendering based on some tips and tutorials I have found online and I don't think that render time is the issue.
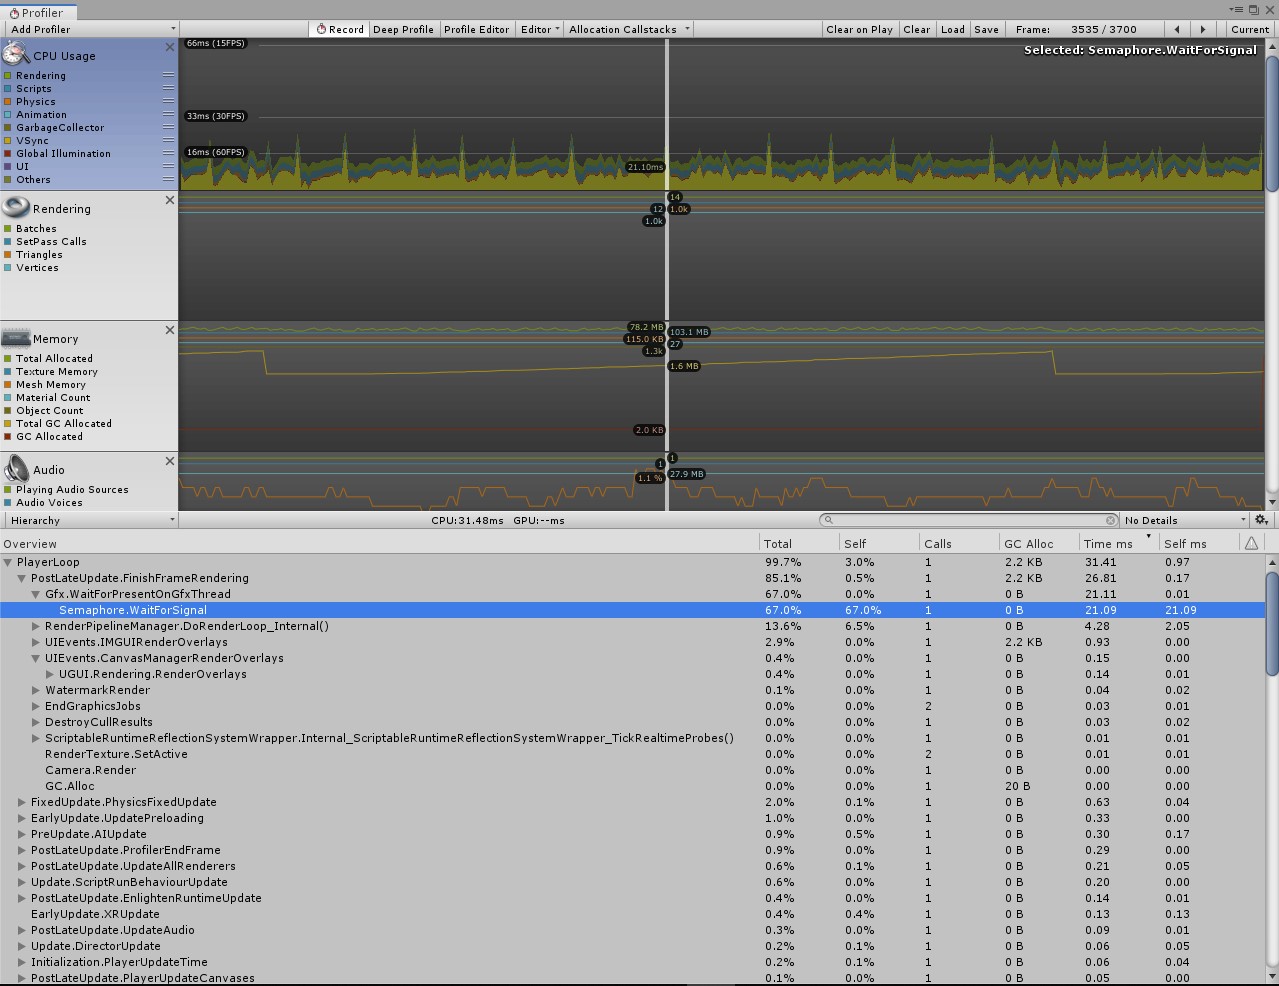
In the profiler, I can find the culprit. It is Semaphore.WaitForSignal which is a child of Gfx.WaitForPresentOnGfxThread.
Here is what the profiler looks like with the spikes.

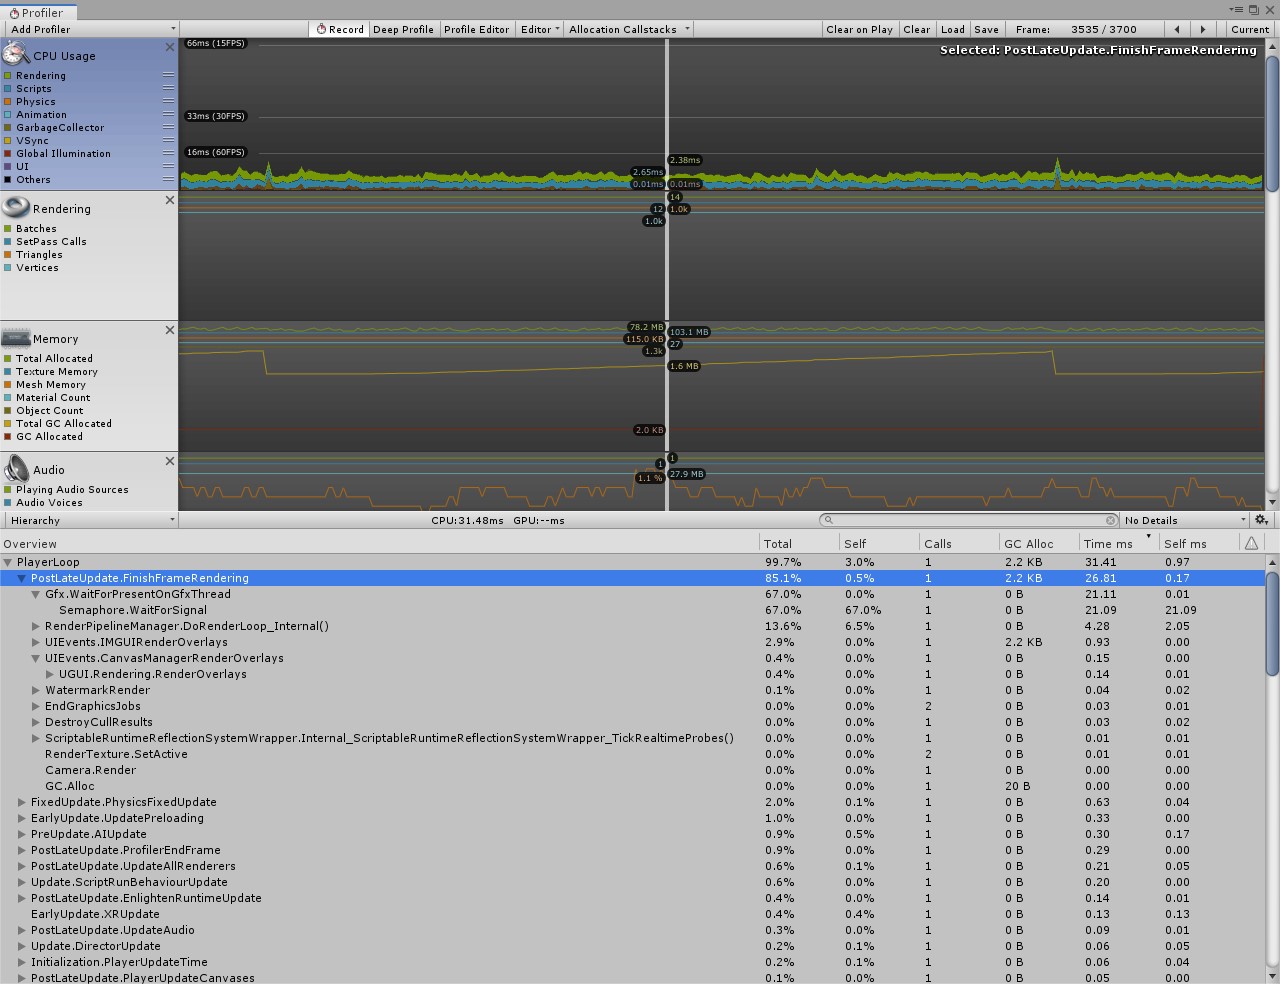
Here is what the profiler looks like with the "Others" box unchecked.

Can someone explain to me what I am doing wrong? Also, can you explain what Semaphore.WaitForSignal and Gfx.WaitForPresentOnGfxThread means?
Hello @Fall3nWarrior, were you wable to solve your issue?
Answer by MartinTilo · Sep 09, 2019 at 11:58 AM
any kind of "...WaitFor..." sample is probably never going to be the culprit to anything. It just tells you that the slowdown is somewhere else to be found and that the thread the sample occured on (in this case the main thread) has a sync point against that other thread (or time delay with VSync).
As these "...WaitFor..." samples indicate a timing issue between threads, hierarchy view is not going to get you very far. You'll have to check it out in Timeline view. Since the Render Thread (which is the one being waited on here) can run past the end of the frame on the main thread, you'll likely want to see what happened on the Render thread one frame before the spike appeared on the main thread. You might be doing too much work on the render thread or the GPU just needs longer to compute the work it gets from the Render thread. You'll have to figure that one out depending on what the Render thread tells you.
It could also be due a build up, where the Render thread drags out further and further into the next main frame, until it can't hit the Flip for the next VBlank, and has to skip it. Seeing how regular that spike is, that sounds like a likely case here.
BTW. That the Wait Time shows up in the "Other" Category is a bug for which the fix is in the process of landing.
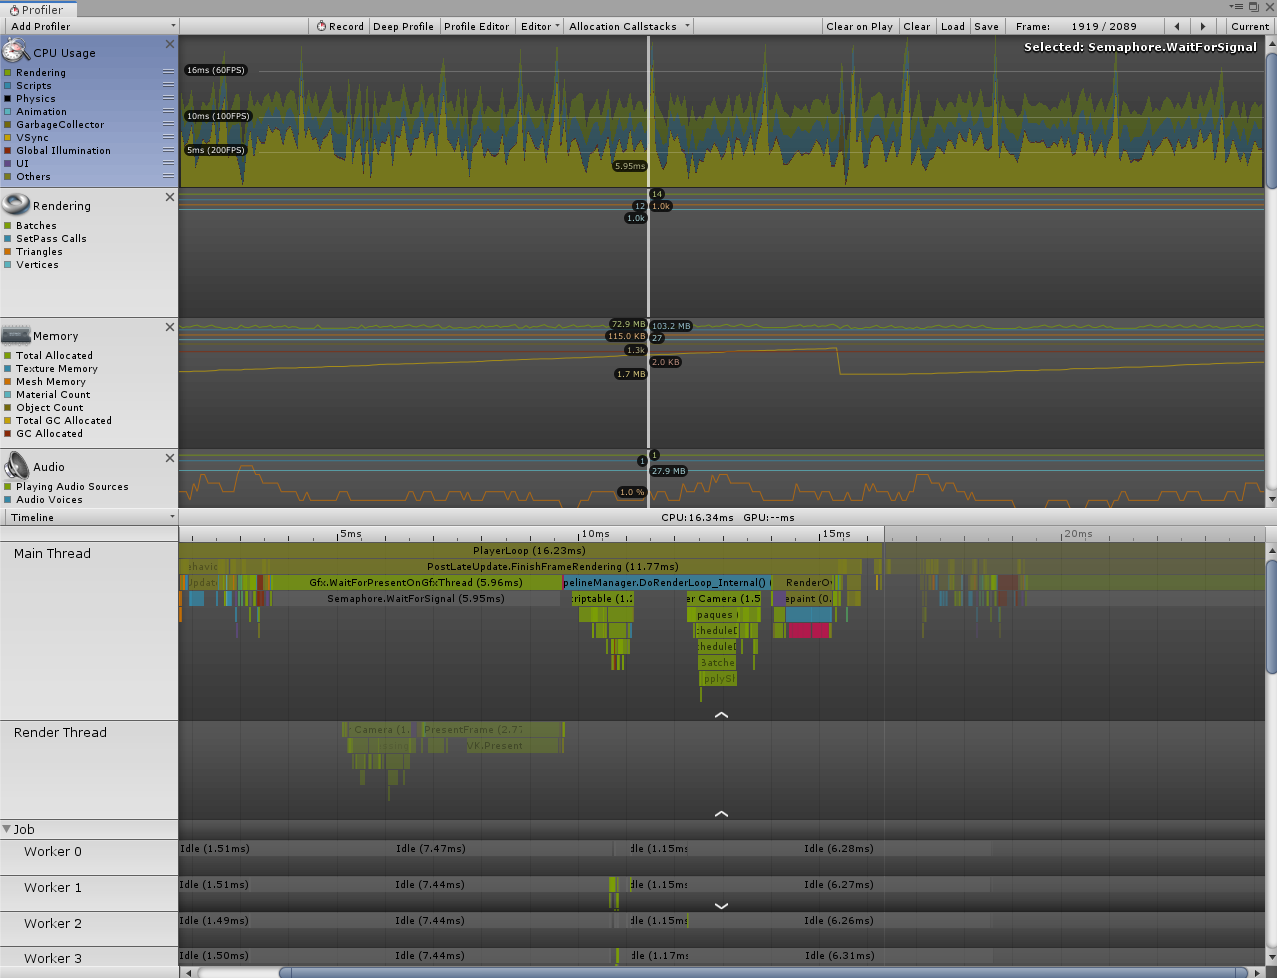
Thank you for the explanation. I switched to the timeline view and took a screenshot of the frame before a spike and the frame when the spike occurs. I still can't seem to find what might be causing this issue. Can you take a look at the screenshots and let me know? Thanks.
Frame Before Spike.

Frame On Spike

So yes, this looks exactly like something on the Rendering Thread bled way into the next frame. As you can see in the second frame, the Rendering thread is still busy with some "transparent" samples, which means they are from a different frame. Even in the first screenshot, there is no rendering sample to be seen that belongs to that frame since they are pushed way out of frame. You should be able to inspect those by scrolling right from the frame before the spike.
It looks like there is quite the gap between the main thread pushing to the Render Thread and the Render Thread responding. $$anonymous$$aybe the Rendering Thread has been pushed off-core during that time? How hot is your device because this looks like you might be seeing Thermal Throttling at work.
Also that Render Thread is mostly Waiting to flip the frame, presumably because it missed a VSync point.
So: -try reducing main thread time and Rendering times some more -maybe lower your targetFrameRate in $$anonymous$$enus while there is no input. All so that the deivce doesn't heat up too much.
Also, semi related, you should probably look at that pink bar in the first screenshot. looks like something is using the old I$$anonymous$$GUI UI and allocating quite some garbage?
@$$anonymous$$artinTilo After reading your detailed explanation, it became somewhat more clear to me that how to read render thread. So I found that mesh skinning was being done on render thread. So I turned off the Compute skinning option and now atleast wait for target FPS is reduced from some what 20ms to 3ms though it did not boosted my FPS much but atleast now FPS is a bit consistent and now I have some direction how to proceed further. Thanks.
Answer by Szmury · Oct 09, 2021 at 04:17 PM
Hey guys I was solving this problem and I did record my whole walkthrough through the problem in my case it was Nvidia Control Panel Solution in video https://youtu.be/ONat52CoHDQ
Hope that someone is having the same problem as I do
Your answer

