Making a dynamic radar type graph
Hello,
i am a beginner, and i have the task to create a graph that allows to add rows (so the shape is not exactly pentagonal or triangular), and to fill it dynamically with inputs from a UI (well it needed to be all UI elements ), i've searched and found that i can use lineRenderer but i want to use only UI elements 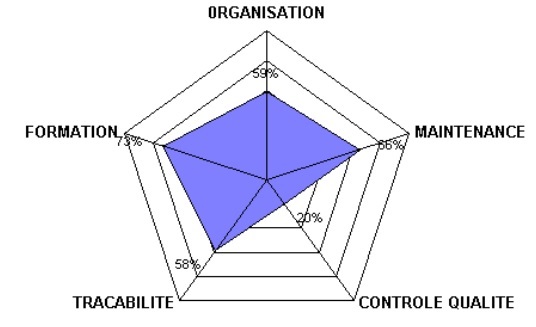
Doing this with only true UI elements might be possible, but it would be many, many orders of magnitude simpler to use a mesh-based approach.
You can still place this group-of-objects in alignment with your canvas and render it with the same camera that renders your UI, and use whatever kind of shader you find suitable. It may be a bit tricky to find the best way to position and align the group, depending upon your needs, but I would still recommend this approach over any alternative.
Have a good long look at the Mesh class API. Also investigate the DrawMeshNow method, which is a very convenient way to draw procedural meshes which change (or might change) every frame. This may or may not be the best way; depends on what you need.
Building a "line" mesh from code is a matter of selecting the start and end points (length), using the cross-product of that vector to get your perpendicular vectors (width), then creating verts whose positions can be established based on these values.
It would be even more efficient and nice-looking to build actual polygon shapes instead of individual line quads; if you can do one, you can do the other. Just gotta get familiar with the Mesh class and building procedural meshes.
Note that this might be overkill. It sounds a bit expensive, too. Consider whether the spiderweb aspect can be a rastar image instead. You could have as many images as the maximum number of data points these graphs will ever display.
Drawing the graph polygon itself follows a very similar process; select the positions for the points, and create triangles which "fills the shapes" defined by these points. The easiest way would involve triangles which each contain two verts on the data graph, and the third vert is the center of the shape.
For both aspects of the task, you'll be constructing these meshes based on N pieces of data, where N is greater than two. Conveniently, you can just "sweep" a circle shape to establish each "spoke" in the shape. If N is 4, each spoke is swept at 90 degree intervals. If N is 5, each interval is 72 degrees, etc.
The vertex of the graph polygon on each spoke then lies along that spoke, at a position defined by whatever percent of the maximum value that spoke is representing that frame.
I thought a lot about doing such a graph in my current project, but ultimately ditched the idea in favor of another data presentation. I always thought it would be really cool though.
I'd be happy to talk more about this idea if this information isn't sufficient to get you going.
Thank you so much for your help, i just finished reading your answer still havent read your links yet, but it sound really hard and will take me like days, while i am supposed to do it today and finish it, and to be honest didn't quiet get the technique you were trying to show me :(
None of the native UI elements are flexible enough to build such a thing, so you'll have to create it yourself. I am assu$$anonymous$$g you wanted to duplicate exactly what is seen in the image you shared, which means you'll need to make this spiderweb shape, and also the graph itself. The best way to make both involves creating a mesh procedurally.
Creating meshes with code is accomplished through the $$anonymous$$esh class. Any time the number of data points changes, you'll need to re-create the spiderweb mesh and the graph. When only the graph data itself changes, you'll need to re-create only the graph mesh.
Fortunately, it's not too difficult to write a method which can do this for you, no matter how many data points you are working with. If it's your first time working with the mesh class, it might seem quite intimidating, but once you dig in and start messing with it, you'll see it's all very straightforward.
Let's focus on the graph part, since it's both easier and more important than the spiderweb. If you can make the graph, you'll know enough to make the web too, or you can use a different way to draw the web, such as multiple rastar graphics; one for each number of data points.
Create a BuildGraph method, which takes an array of float values. These are the values the graph will represent. The length of this array informs the method of how many data points the mesh will need. I also assume that your values array contains values between 0 and 1, representing between 0 and 100 percent of the category's max value.
No matter how many data points you have - as long as its more than two - you can use the exact same algorithm to build each graph.
You'll define the maximum size of the graph. That is, how far from the center of the mesh should a data point representing 100% be. (below I called this value maxSpokeLength)
$$anonymous$$nowing this, you'll create a mesh with the $$anonymous$$esh class, and start adding verticies in the appropriate locations to represent your data.
Finding the appropriate locations mathematically isn't too difficult. Your function knows everything it needs to figure out where to place each vertex. The function will have the following basic shape. I'm not doing all the work for you, just giving you an outline. Please note this code is untested.
 void CreateGraph( float[] values ) {
   // You'll create a $$anonymous$$esh object and operate on its vertex array.
   // Here I'm showing an array of Vector3's ins$$anonymous$$d, which is what
   // the $$anonymous$$esh object expects.

   Vector3[] verts = new Vector3[ values.Length ];

   // this is how many degrees "apart" each "spoke" of the graph is
   float sweepArcDegrees = 360f / values.Length;

   for (int i = 0; i < values.Length; i++) {
     Vector3 v = Vector3.up;

     // "rotate" this vector based on the sweep angle
     // and the data point we're representing (the i'th point)
     float rad = (sweepArcDegrees * i) * $$anonymous$$athf.Deg2Rad;
     float c = $$anonymous$$athf.Cos(rad);
     float s = $$anonymous$$athf.Sin(rad);
     v = new Vector3( c*v.x - s*v.y, s*v.x + c*v.y, 0);

     // now the vector is pointing the correct direction
     // but it's just a direction; we need it to become a
     // point whose distance along this direction is
     // related to the value we're representing
     // remember the values array contains values between
     // 0 and 1, representing 0..100 % of this graph category
     v = v.normalized * values[i] * maxSpokeLength;

     verts[i] = v;
   }
   // at the end of that loop, you should have an array
   // of vector3 points representing the points on your graph
   // then you'll use another loop to make triangles for your
   // mesh based on these data.
   // That part isn't too difficult, and hopefully this
   // will give you a strong place to start from.

   // once the mesh has triangles, it's ready to be drawn, whether
   // by assigning the mesh to a $$anonymous$$eshFilter on a GameObject,
   // or by using the Graphics.Draw$$anonymous$$eshNow() method.
 }
oh thanks .. well i was trying to create a triangle just to get used to this whole concept and i really thank you for the code snippet, i was just searching for something like this only i have a phobia of mathematics ^^ thank you. asap i will post some of my previous code.
I was notified about a comment which is no longer visible - perhaps it was deleted. The question asked was:
"sorry but can you tell me why this line after the loop : Vector3 v = Vector3.up"
This is just because you need a vector to start from, and Vector3.up should be equivalent to a "12 o'clock" position, assu$$anonymous$$g you're working on the XY plane. It could be any planar vector really, and is used to set the first data point's position, in this case, to 12 o'clock.
You can also use simple mesh and bones made in Blender, then easy manipulate them in Unity, at start read theirs position (max value), min value is center (which is origin of "radar statystyk" object). Then you can easy use sliders or whatever other thinghs to manipulate this from game view.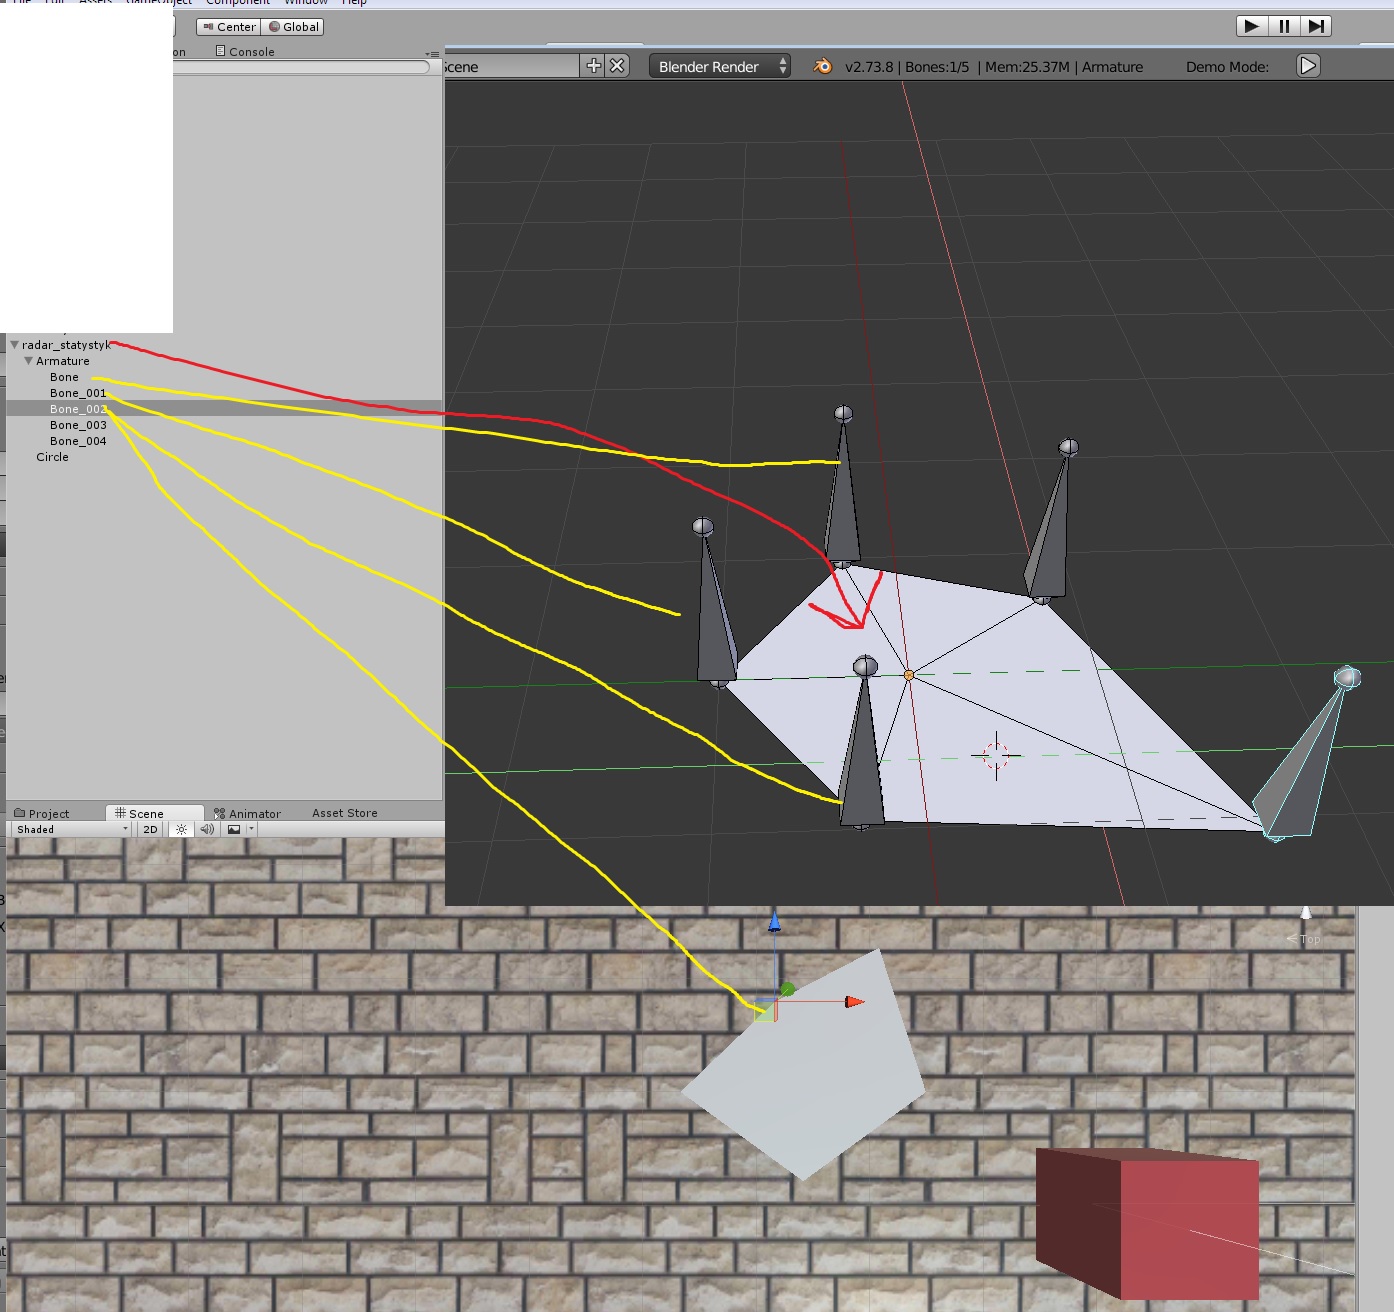 .
.
Thank you, but as i mentioned up here it needs to be generic so the bones number is unknown, it maybe 3 as it maybe 15, so basically i need a code that calculate it each-time...
This is a great idea though, @$$anonymous$$amil1064. I've used a similar method to create circles of arbitrary thickness at runtime. Just weight the inner ring to a bone. It doesn't satisfy the OP's needs, but it deserves an upvote for the effort. ;)
hi this is the code I've been working on, i have a new problem with it, when i click run its only draw one side of the triangles i don't get it... help please !!!
i am attaching the code to an emptyobject, this is the code:
 using UnityEngine;
 using System.Collections;

 public class MeshGen : MonoBehaviour
 {

     public float x = 20f;
     public float y = 20f;

     // Use this for initialization
     void Start ()
     {
         MeshFilter mf = GetComponent<MeshFilter> ();
         Mesh mesh = new Mesh ();
         mf.mesh = mesh;

 //        MeshFilter mf0 = GetComponent<MeshFilter> ();
 //        Mesh mesh0 = new Mesh ();
 //        mf0.mesh = mesh0;

         //les points
         Vector3[] points = new Vector3[6]
         {
         ///*0*/new Vector3 (0, 0, 0),

         /*0*/new Vector3 (x, 0, 0),
         /*1*/new Vector3 (0, y, 0),
         /*2*/new Vector3 (-x, -y, 0),

         /*3*/new Vector3 (x - 5.0f, 0, 0),
         /*4*/new Vector3 (0, y - 5.0f, 0),
         /*5*/new Vector3 (-x + 5.0f, -y + 5.0f, 0)


 //        /*6*/new Vector3 (width - 10.0f, 0, 0),
 //        /*7*/new Vector3 (0, height - 10.0f, 0),
 //        /*8*/new Vector3 (-width + 10.0f, -height + 10.0f, 0)
         };

         // les triangles

         // les triangles de bases
         int[] tri = new int[3];

         tri [0] = 0;
         tri [1] = 2;
         tri [2] = 1;

         int[] tri0 = new int[3];
         tri0 [0] = 3;
         tri0 [1] = 5;
         tri0 [2] = 4;

 //        int[] tri2 = new int[3];
 //        tri2 [0] = 6;
 //        tri2 [1] = 8;
 //        tri2 [2] = 7;

         // triangle des cotes en rect

         int[] tri1 = new int[6];

         tri1 [0] = 1;
         tri1 [1] = 0;
         tri1 [2] = 4;

         tri1 [3] = 4;
         tri1 [4] = 0;
         tri1 [5] = 3;

         int[] tri2 = new int[6];

         tri2 [0] = 2;
         tri2 [1] = 5;
         tri2 [2] = 0;

         tri2 [3] = 5;
         tri2 [4] = 3;
         tri2 [5] = 0;

         int[] tri3 = new int[6];

         tri3 [0] = 2;
         tri3 [1] = 1;
         tri3 [2] = 5;

         tri3 [3] = 5;
         tri3 [4] = 1;
         tri3 [5] = 4;

         //Les normales

         Vector3[] normales = new Vector3[6];

         normales [0] = -Vector3.forward;
         normales [1] = -Vector3.forward;
         normales [2] = -Vector3.forward;
         normales [3] = -Vector3.forward;
         normales [4] = -Vector3.forward;
         normales [5] = -Vector3.forward;
 //        normales [6] = -Vector3.forward;
         //les UV Maps

         Vector2[] uv1 = new Vector2[6];

         uv1 [0] = new Vector2 (0, 0);
         uv1 [1] = new Vector2 (1, 0);
         uv1 [2] = new Vector2 (0, 1);
         uv1 [3] = new Vector2 (1, 1);
         uv1 [4] = new Vector2 (0, 0);
         uv1 [5] = new Vector2 (1, 0);


         Vector2[] uv2 = new Vector2[6];

         uv2 [0] = new Vector2 (0, 0);
         uv2 [1] = new Vector2 (1, 0);
         uv2 [2] = new Vector2 (0, 1);
         uv2 [3] = new Vector2 (1, 1);
         uv2 [4] = new Vector2 (0, 0);
         uv2 [5] = new Vector2 (1, 0);

         Vector2[] uv3 = new Vector2[6];

         uv3 [0] = new Vector2 (0, 0);
         uv3 [1] = new Vector2 (1, 0);
         uv3 [2] = new Vector2 (0, 1);
         uv3 [3] = new Vector2 (1, 1);
         uv3 [4] = new Vector2 (0, 0);
         uv3 [5] = new Vector2 (1, 0);


         // affectation des vecteurs
         mesh.vertices = points;
         mesh.triangles = tri1;
         mesh.normals = normales;
         mesh.uv = uv1;

         mesh.vertices = points;
         mesh.triangles = tri2;
         mesh.normals = normales;
         mesh.uv = uv2;

         mesh.vertices = points;
         mesh.triangles = tri3;
         mesh.normals = normales;
         mesh.uv = uv3;
     }

     // Update is called once per frame
 //    void Update ()
 //    {
 //
 //    }
 }
I'm not sure I understand everything you're doing. A mesh should have one array of verts, tris, normals, uvs, but I see you with apparently several variants of each. I assume that's all just for testing? For example, in the code above, only the tri3 and uv3 arrays are doing anything, because they are the last to be assigned to the mesh. The other arrays assigned immediately before are not being used at all.
Also, you are hard-coding a lot of values. Again I assume that's because you're testing the concepts. In practice, all of these values will be deter$$anonymous$$ed algorithmically.
The order of operation will generally be:
establish verts, array of vector3's
establish tris, array of int's
establish uvs, normals, tangents, colors, if necessary
assign these to the mesh
A triangle in Unity only has one side. If you want it to be visible from both sides, you'll either use a shader which can draw both sides of a triangle (none of the stock Unity shaders do this, IIRC) - OR - you'll need to create a second triangle which faces in the opposite direction.
The direction in which a triangle faces is deter$$anonymous$$ed by the winding order. In other words, 1,2,3 faces one way, and 3,2,1 faces the other. This is one of the more confusing aspects of writing a mesh generation algorithm, but once you figure out the correct order, you're all set.
