Total GC increases without GC allocated
I'm memory profiling my game and i'm trying to explain something. There is a periodic increase in memory that seems to come from something other than my scripts. In the hierarchy i can usually see which script is responsible for an increase in allocated memory, but in this case it looks like it just doesn't register. The GC allocated graph seems to confirm that this does not originate from my scripts, so what are other things that could be causing it? Does Total GC allocated include stuff from the engine? If so how do i find out what it is?
One caveat is that i'm running some background threads but as far as i can tell i disabled them all for this profiling round. I verified that if a thread other than the main tread allocates memory it will show up in Total GC but not in GC allocated. That being said, is there something else that will show up like this? 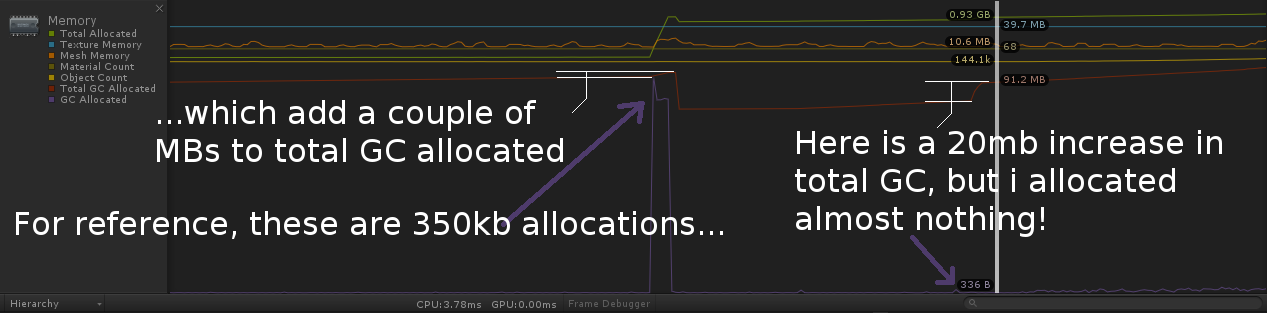
It seems the mystery allocations are done in between frames!
I made a script that uses System.GC.GetTotal$$anonymous$$emory(false) to measure the total amount of allocated memory in Update and used Script Execution Order to make sure this script is the very first script to have its update method called. I then use a coroutine with WaitForEndOfFrame() to measure it again. According to the documentation this Waits until the end of the frame after all cameras and GUI is rendered, just before displaying the frame on screen. Between update and end of frame i see expected amounts of memory being allocated. The weird ones seem to happen between end of frame and the next first update of the next frame. According to the execution order not much happens in between. OnApplicationPause (but i'm not pausing), OnEnable and OnDisable, physics updates and input updates. Granted, physics could be the culprit but at least FixedUpdate should register normally in the profiler. I'll investigate physics further, but i'm not using a lot of physics save for a couple of raycasts.
Have you created a deep profile? Also what "stuff" do you use? Do you use physics / uGUI / Nav$$anonymous$$esh / Terrain / ...? When exactly does this jump happen? Just after some idle time or do you provide any kind of input? Even changing the camera direction counts as input.
You said "periodic increase". Does that mean it's constantly increasing and raising the average memory usage over time? How long did you run your test? ever run out of memoty?
Yep, the screenshot is from a session with deep profiling enabled. The hierarchy view shows the purple allocations, a couple of kb, but nothing that amounts to 20mb. I use no uGUI, Nav$$anonymous$$esh or Terrain. Physics is only a couple of raycasts. The jumps seem a bit unpredictable but keep happening every $$anonymous$$ute or two. The camera moves continuously and is rotated by the player (looking around). I don't run out of memory, the allocations are reclaimed later when garbage collection occurs. The problem is that i get a hiccup both at the time of the allocation and at the garbage collection that cleans it up. I do generate some meshes procedurally so the next thing i'm going to check is whether or not assigning a (low poly) physics mesh stays off the profiling radar.
How often do you generate those meshes? Do you reuse the mesh instances or do you create new ones? If you create new ones, do you Destroy your old? $$anonymous$$eep in $$anonymous$$d that the internal meshcollider generation is quite heavy (convex or normal?).
Well i finally found what was causing the allocations. Long story short: if the console says "The profiler has run out of samples for this frame. This frame will be skipped. Increase the sample limit using Profiler.maxNumberOfSamplesPerFrame", don't ignore it! The frame that was responsible for the allocations was skipped, causing the measurements for GC allocated to be dropped. But the allocations were visible in the next frame that was not skipped through total GC.
Long story long: we were running some background threads to do some heavy lifting. As i said before, it a background thread allocates memory the profiler won't show it in GC allocated. So we made an option to run everything on the main thread. Of course you get terrible performance but the goal was to figure out which method was responsible for the memory. So now you have some updates that take a very long time. I don't know the specifics of the profiler but my hunch is that it just checks what the main thread is doing every couple of nanoseconds and then attributes any time spent that way. Of course if a frame takes an excessive amount of time then you get the error quoted above, the profiler will run out of samples. The thing i missed every time is that it actually literally tells me that it skipped the frame. So the answer was to to exactly as the error suggested, i increased the maximum amount of samples.
And of course it makes sense that the frame that takes so much time that the profiler runs out of samples is the frame that allocates a huge amount of memory.
