- Home /
Help Understanding Profiler - No info
Hello,
I need help understanding whats happening with my app, which is lagging and is imposible to use.
I have connected the profiler but I am being unable to get any extra info of whats happening

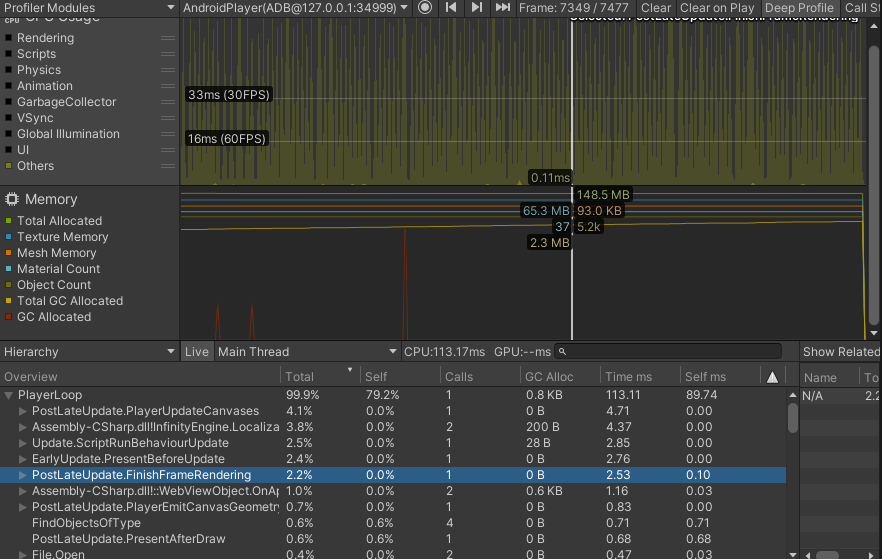
once every 2 frames it spikes to 100ms, all the overhead is created by the "others" tab
The playerloop is 113 ms but when I click to see the details I only see information of arround the 17% of the overhead.
Any suggestion to debug the app?
Answer by andrew-lukasik · Jun 04, 2021 at 09:28 AM
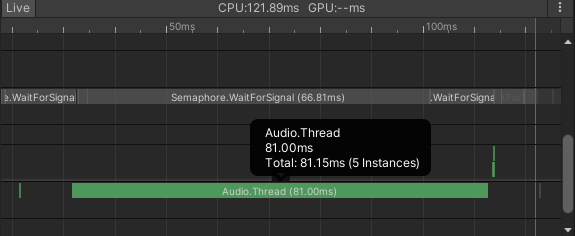
look into "Raw Hierarchy" and "Timeline" views too (the latter one shows sequence and execution dependencies more clearly)
try deep (script) profiling
profiler data can be saved to file and shared here for others to inspect
hello, thanks for the suggestions, it looks is something related with sound

i will do some tests and come back with the results
Thanks @andrew-lukasik I managed to locate the issue, I have recently update to 2019 lts version and it looks like something has changed regarding jar management and one library no longer works, using deep profiler saw some logs that didnt appear at build first.
Your answer

