- Home /
Unnamed Texture blocks in Memory Profiler.
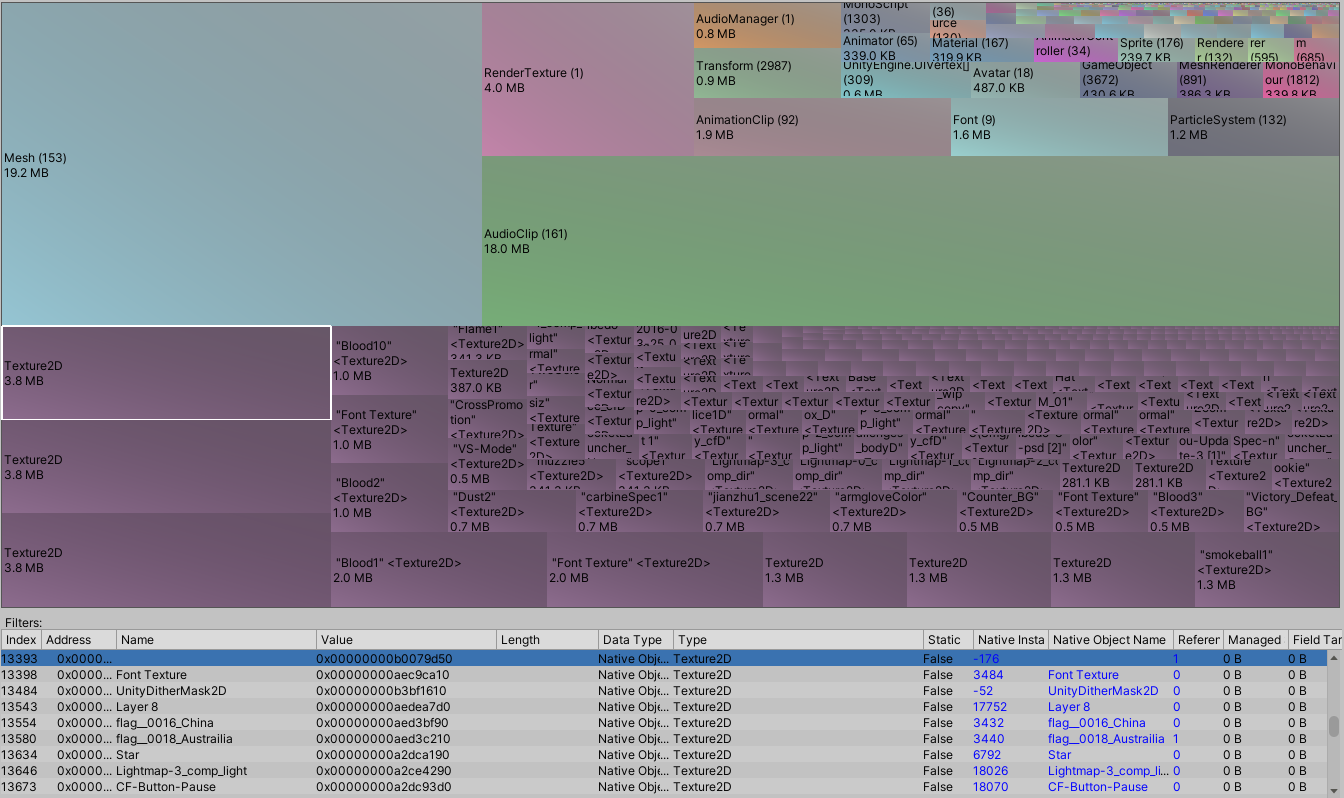
Hello everyone. So i've been trying to reduce memory usage of my android game using the Unity Memory Profiler. I'm using Unity 2019.4.3f1 and Memory Profiler's latest package (Version 0.2.9) and I'm observing some unnamed Texture blocks which are assumingly taking up almost 15.3 MB in total. There are three blocks of 3.8 MB and three blocks of 1.3 MB in the Texture block (screenshot attached). I have no idea about the reason behind this. I've looked up the internet but haven't found any solution.
I found a link: Empty Line Texture
There are no DestroyTextureCalls and i've also tried using Unity 2019.4.15f1 but the blocks just get bigger. The one with the size 3.8 MB reaches up to 7.6MB. Is this a Memory Profiler bug? Or is there any kind of texture that persists in memory due to its compression format and isn't destroyed while switching scenes? I have a DontDestroyOnLoad Canvas for my game which includes a Top bar and some other UI panels. I have tried removing it but it hasn't made any difference. Any help would be appreciated. 
Answer by unity_7CBV7b84AJQ2XA · Apr 02, 2021 at 04:47 AM
@MartinTilo can you please help?
Hello, Not really monitoring Unity Answers and as the documentation for the memory profiler states, the best place for questions is the Profiler Previews sub-forum in the Betas & Experimental Features sub-forums. Speaking of, this thread in there might have the hints you need for this, and if not it might be better to build on that thread, than open another line on the same topic here.
Your answer

