- Home /
Why does memory usage in Unity Profiler smaller than memory usage showed in Xcode?
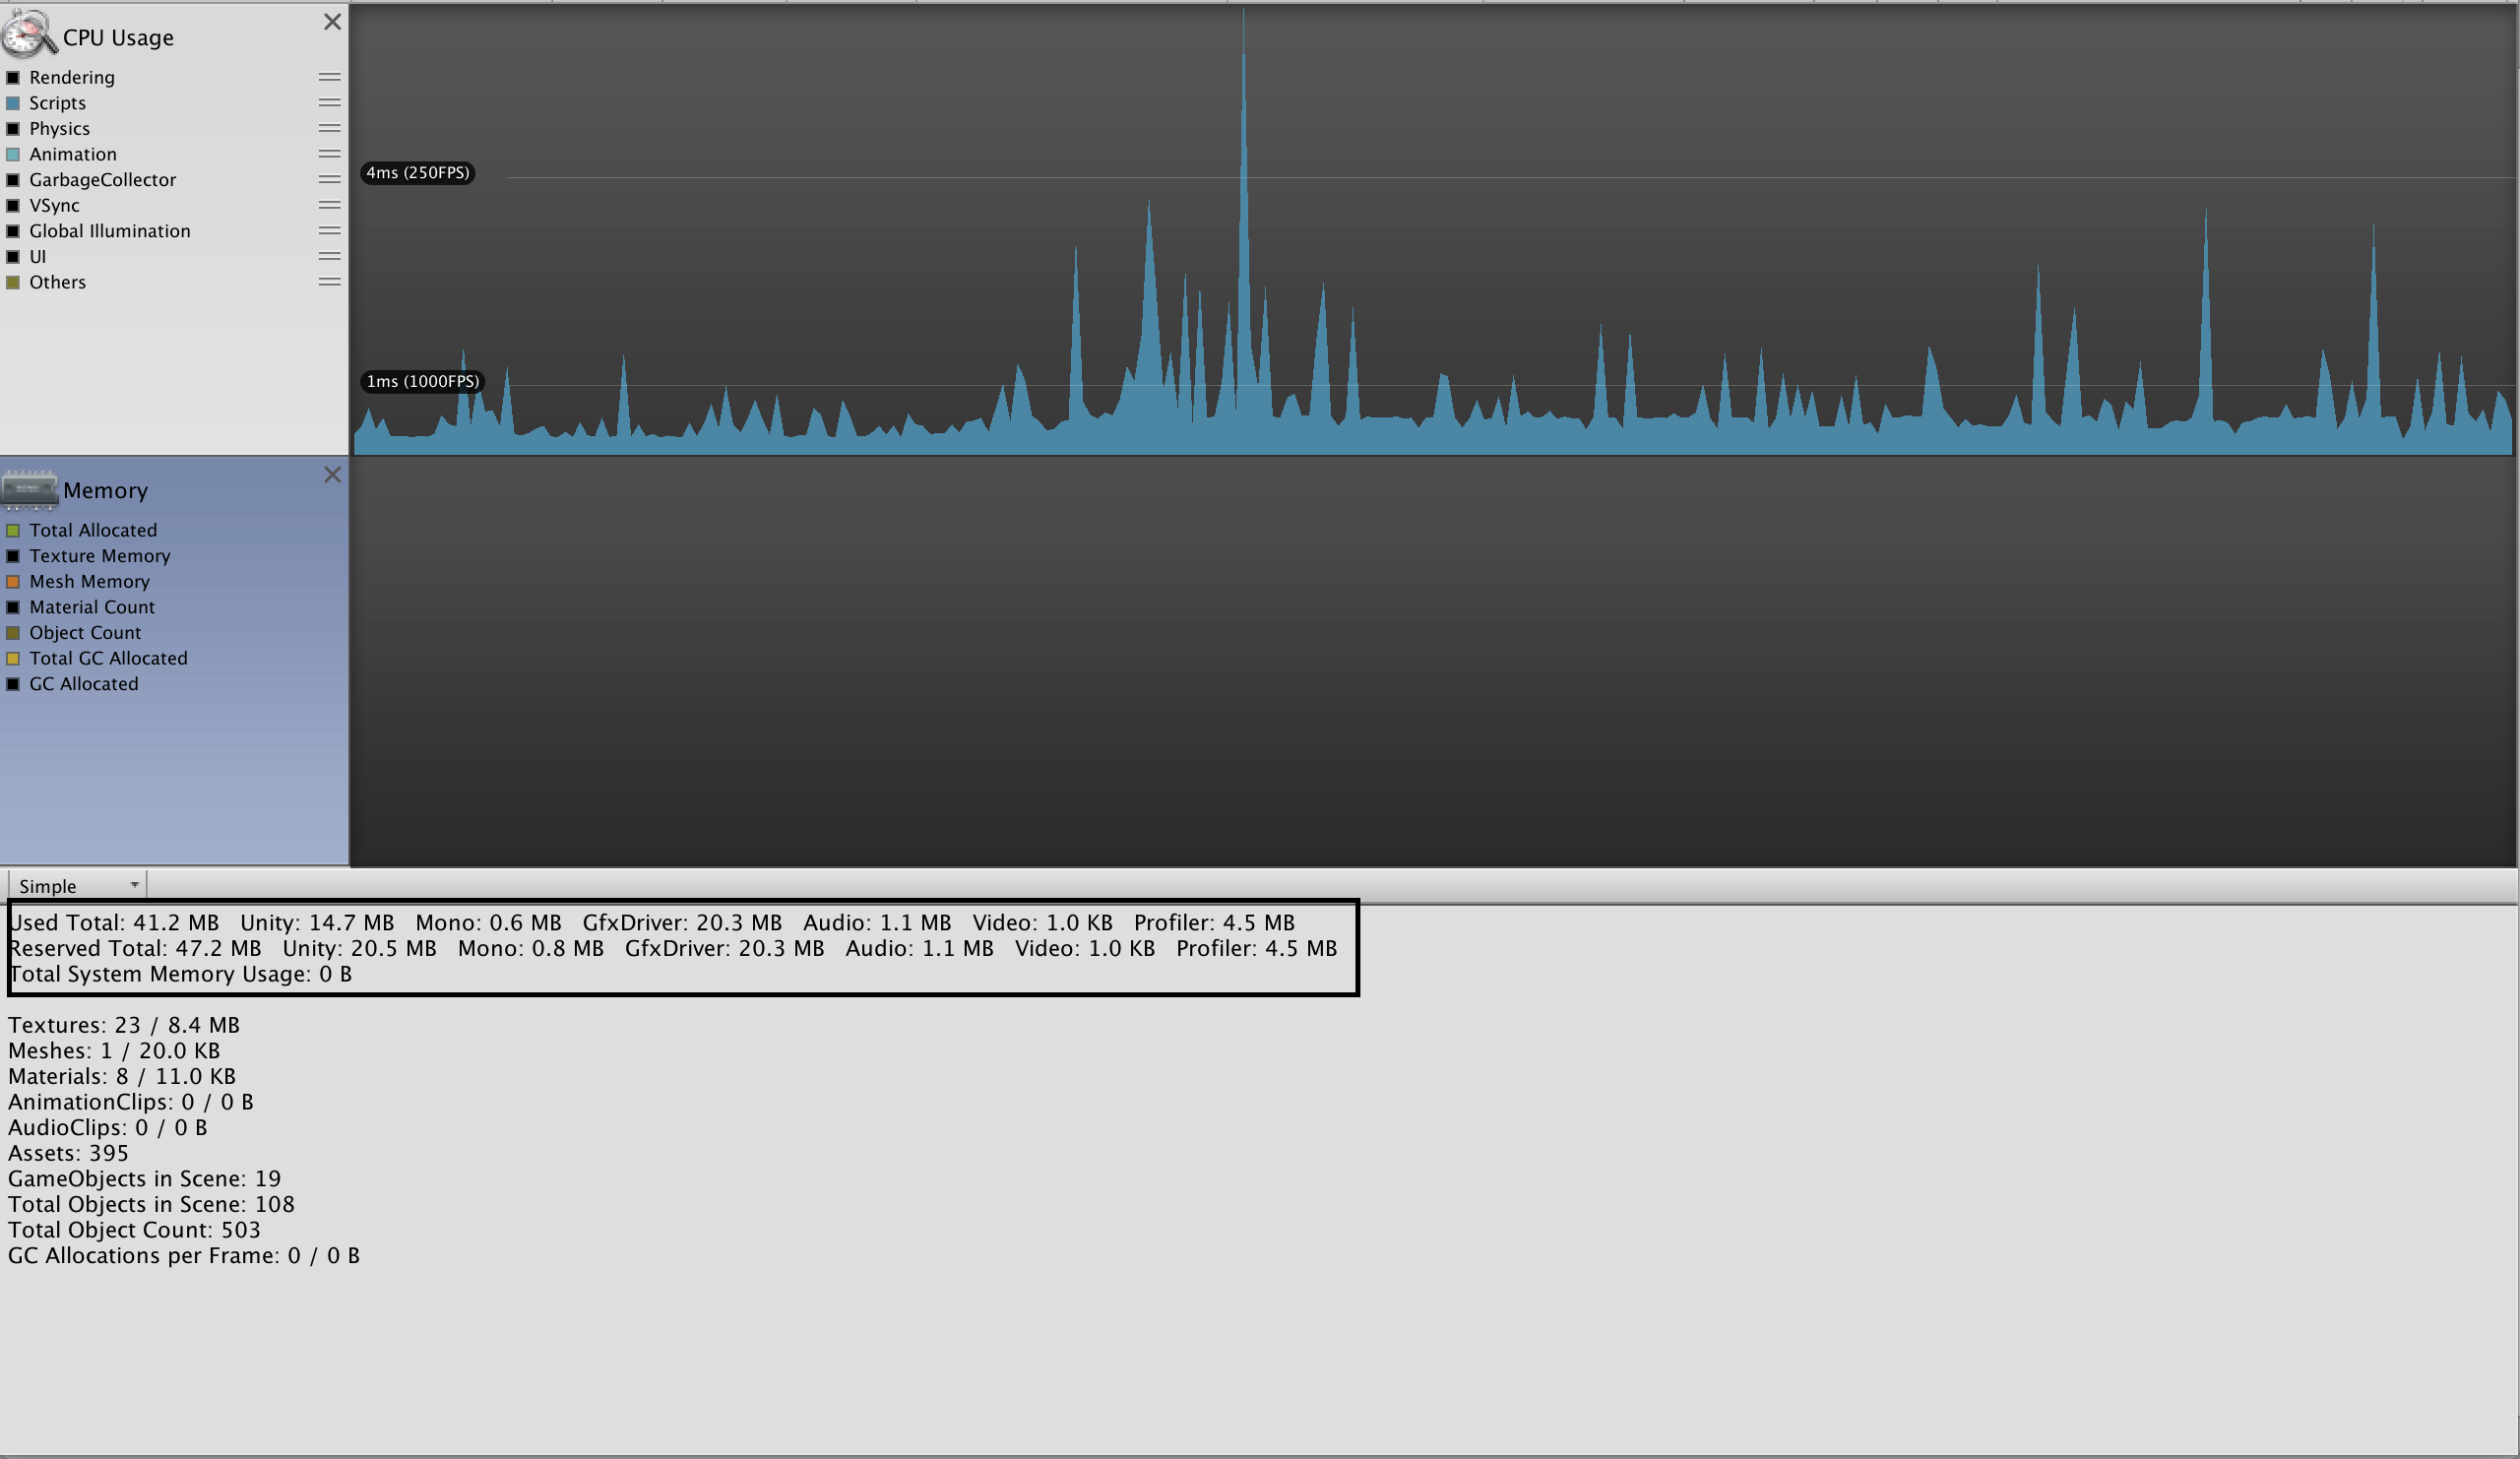
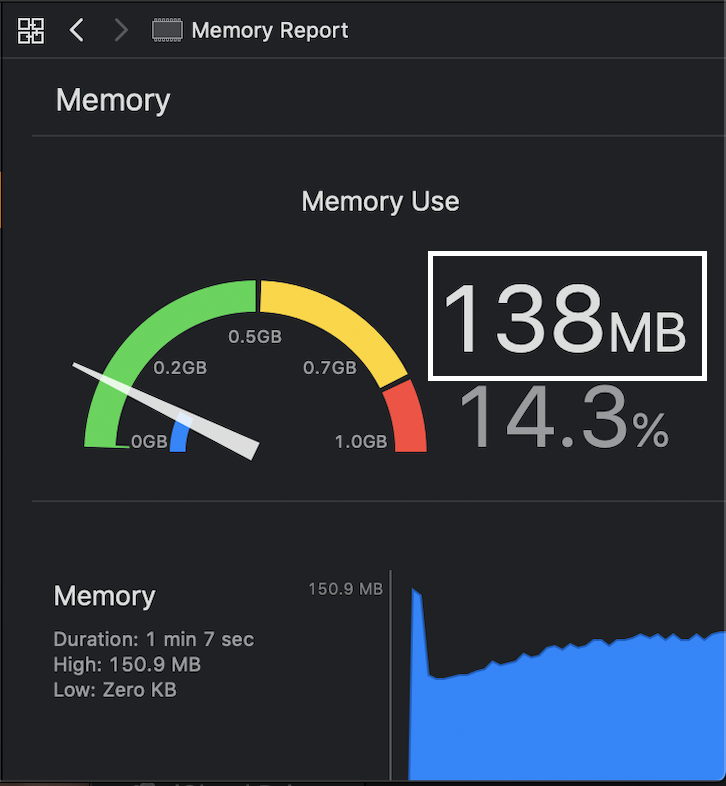
Hi everyone! I'm trying to optimize my game and tried to measure via iPad Mini 2 remote profiling on both Unity and Xcode. But I saw that memory usage is different.
Specifically, I'm using Unity 2019.1 and it showed: Used Total: 41.2 MB, Reserved Total: 47.2 MB  Xcode is 138 MB.
I don't know why this happens. Could anyone help me to figure out why 2 numbers are different? Thank you very much! :D
Answer by ryanmillerca · Jul 22, 2019 at 07:12 PM
Lots of reasons! For starters, a different operating system with totally different CPU architectures. iOS also uses different compression methods for Textures and other assets. If you want to get accurate iOS profiling for memory, use the remote profiler and attach it to your iOS device (or keep using the XCode one as you are now).
@ryanreptoid Thank you for your reply,
Sorry for my missing, I edited my question. The result showed above is remote profiling by the iPad $$anonymous$$ini 2. And the result is different So I don't know why.
Could you give me some explains for this?
Oh, I see now! Yes, definitely more confusing in that context. I believe the profiler is only measuring Unity's impact, while XCode is reporting the RA$$anonymous$$ usage of the entire device. Also, the $$anonymous$$emory tab may not include VRA$$anonymous$$ allocation (which would be under the GPU section) which shares memory with the system.
Yes, maybe $$anonymous$$emory tab not include VRA$$anonymous$$. So how could I see VRA$$anonymous$$ on Unity Profiler? On my $$anonymous$$acBook GPU tab is disabled :(
Your answer

