[Android] Unity profiler not showing actual memory usage on device?
Hello!
I've been having a few issues while profiling.
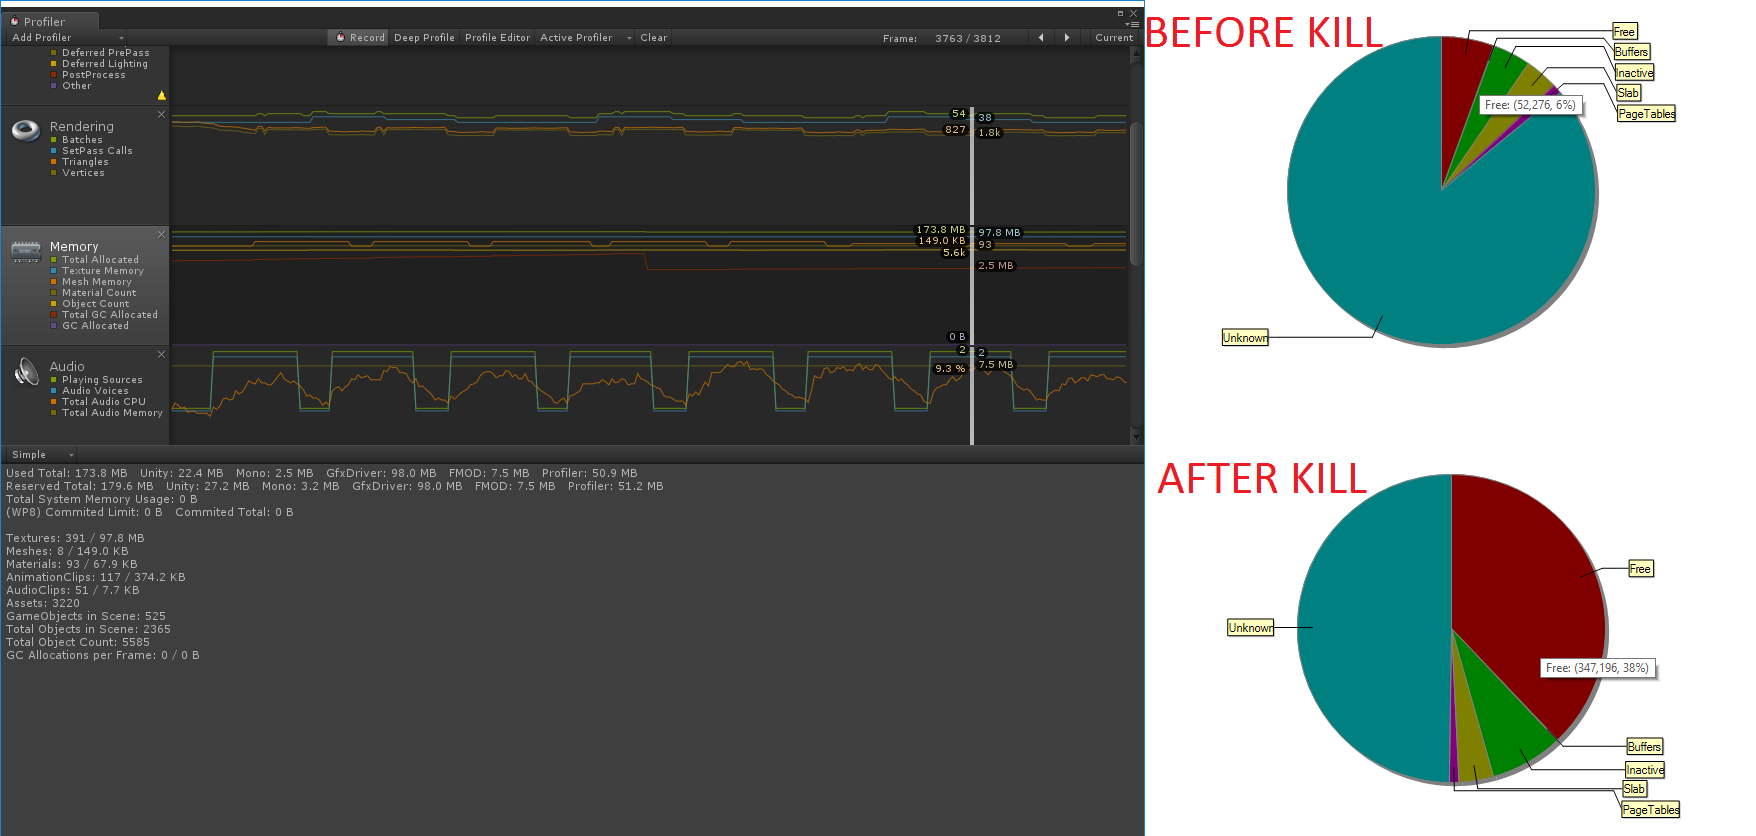
The actual issue : Unity takes up much more memory on device than the profiler has led me to believe . Here is a picture which sums up what i'm seeing in terms of memory usage. This is what happens when i play my game and then force close it. 
The screenshot is of a 1GB Asus fonepad 7.
The SDK tools monitor shows that the actual memory usage is atleast 150MB off of what the profiler reports. I'm also seeing simillar figures with the unity profiler disabled. Needless to say, this leads to crashes and instability on lower-powered devices or devices with a lot of simultaneously running applications .
Any help or suggestion would be greatly appreciated.
Using Unity 5.2.0f3
Your answer

Follow this Question
Related Questions
ios profile memary confused 1 Answer
Cant save file into Android internal memory 1 Answer
Profiler Stops Updating on Change Level 0 Answers
Crazy high RAM usage on IOS 0 Answers
