- Home /
How come memory usage is so high on Linux, and the profiler lies about it?
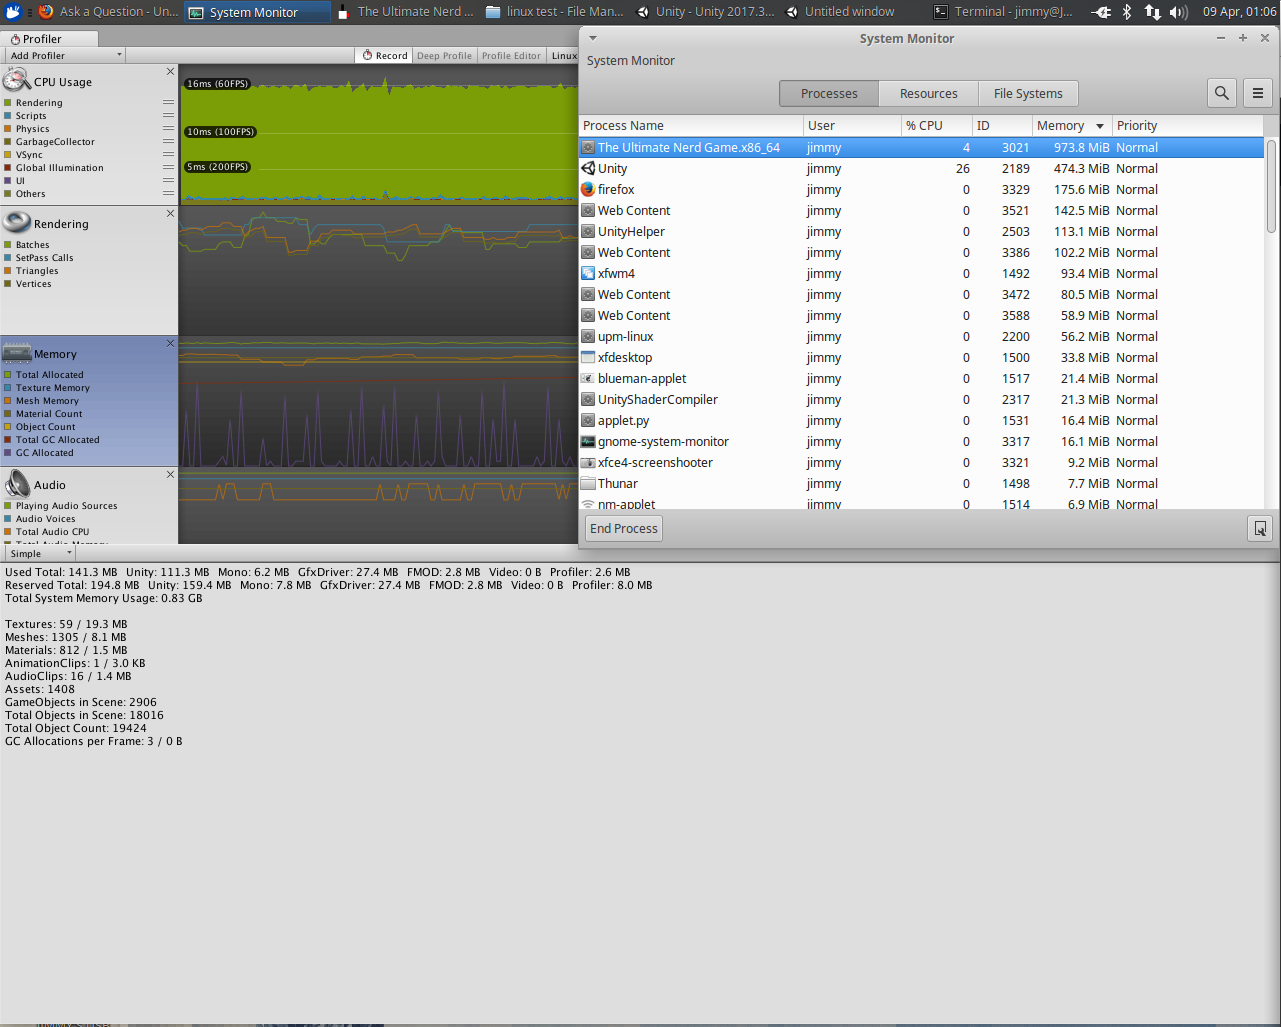
On Windows, my game uses about 200MB on the title screen. On Linux, it uses about a gigabyte for me, and my Linux players have reported everywhere from the regular 200MB through 1.5GB. I made a debug Linux build of the game and connected it to the profiler in an attempt to see where all the memory was. The profiler claims that only 200MB are used, but my system monitor shows that it's actually a gigabyte.
Why the discrepancy? Why does Linux eat so much more memory? I'm sorry if this is obvious, I have not used or developed for Linux very much.
I couldn't tell you whether there are actually significant memory usage differences with Unity builds in Linux, but I can tell you that memory reporting in nix is often misleading. The system tends to hold on to memory even when it's not being used, then opportunistically free it when it's needed elsewhere... I don't know whether this could be what's going on here, so I'm leaving this as a comment for your reference rather than an answer.
Thanks, I didn't know about that. I used the ter$$anonymous$$al to do more detailed diagnostics on memory usage, and it confirmed that the RA$$anonymous$$ is being used by my game, not the disk caching system.
Answer by hodler · Oct 28, 2019 at 02:23 PM
I'm experiencing the same problem with a headless linux server. When i start up the server the memory usage shown in the system monitor is roughly the same as the unity memory profiler. Once some users connect to the server the memor iusage goes up. the server seems to be garbage collecting and the memory usage in the profiler drops once in a while so the memory stays pretty constant over time. The system memory however keeps growing continuously and never drops even after the clients disconnect. The discrepancy grows everytime new users connect and disconnect.
I cannot deploy the server like this, since it is destined to crash after a couple of hours due to system memory reaching full capacity.
Has anyone else experienced the problem and was able to solve it? Since the memory profilere tells me everything is fine i am not able to track down the cause of this.
Edit: Also the problem doesn't exist on a windows headless build, only on linux
Your answer

Follow this Question
Related Questions
Understanding Profiler: Profiler Memory Shows GC Allocation but Overview does not 1 Answer
TEXTURE has wrong size in memory 1 Answer
Total memory allocated increases indefinately from .80GB untill crash 3 Answers
what Memory Usage difference between Unity Profiler and procrank 0 Answers
Modo memory use increases steadily 0 Answers
