Semaphore Wait for signal accounts for 80% of total cpu usage.
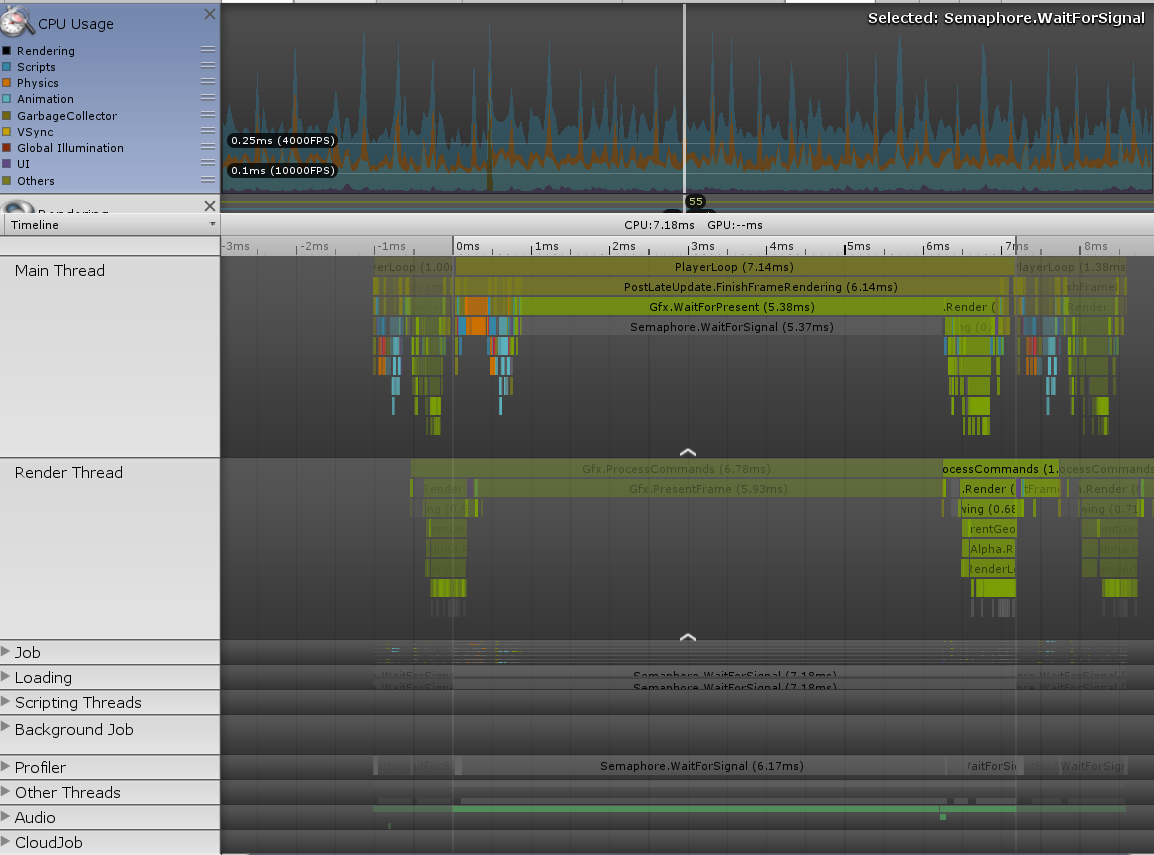
As seen in the screenshot semaphore.WaitForSignal is costing up to 5.37 ms per frame. That is roughly 80% of my entire game's cpu usage.
Sometimes I will get random spikes of up to 400ms due to the same reason causing my game to stutter horribly.
It is a 3d game with no lighting. I'm using unlit shaders only. My biggest texture is 1536 x 1536 which I'm only mapping on a single object.
How can I reduce or eliminate this?
In case somebody else is having trouble with the stuttering issue caused by the 400 ms spikes I fixed this issue by upgrading unity from version 2019.1 to 2019.2
Which 2019.2 version did you upgrade to? Because there are many versions from 2019.2.0 to 2019.2.21.
I'm currently using 2019.2.19 and haven't had the issue.
Hey @onuralp20002 , Did you try out 2019.2.19? Are you still facing the same issue?
I am using 2019.3.7f1 recently and I am having the same problem. I am creating a very simple android game and when I use GTX1050TI as my graphic card it gives about 150fps. But when I switch to a smaller graphic card, it is about 20fps and it is too less for a simple game like I am creating right now. I am dowloading 2020.10b5 right now which is in beta version. I hope that it will fix the problem. I am open to any suggestions. I will share if 2020 version fixed the problem or not. @photonman170
I'm using 2019.3.11f1 and I'm experiencing similar issues. This dropout occurs only on Android devices and not on iOS. This may be an Android-specific glitch. If you have any countermeasures, please let me know.
I have the same question in 2019.2.15f1 and 2019.3.7f1. I am very unhappy.
Same problem. It happens cyclically, regardless of what is displayed on the screen. On Windows, Build or Editor. Unity 2019.30f5
It just means the main thread is sleeping, waiting for a signal from another thread. It's not actually consuming CPU time. The render thread is working instead, and I guess that at some point this render thread signals the main thread when it is done.
So that basically means that no matter how many ms it is saying that Semaphore.WaitForSignal takes it actually doesn't take that time at all? Even on a real device?
Because I have the same issue. I managed to get my draw calls down to 26, I am allocating a few bytes of gc alloc every few frames but the semaphore thing takes 27.17 ms out of $$anonymous$$e 48.18 total time
Just in case anyone is stumbling upon this issue in Sep. 2021 (Like I do, lol) and is sitting on a Mac: In my case I just switched to opengl, restarted IDE, switched back to Metal and restarted IDE again and now everything is so fast. Used Unity for months and never knew that this Editor can actually run fast.
In my case I literally just had to close the Logcat tab. It was causing these spikes every few moments, but it only happened in the editor.
