- Home /
Detailed Memory Profiling on Device
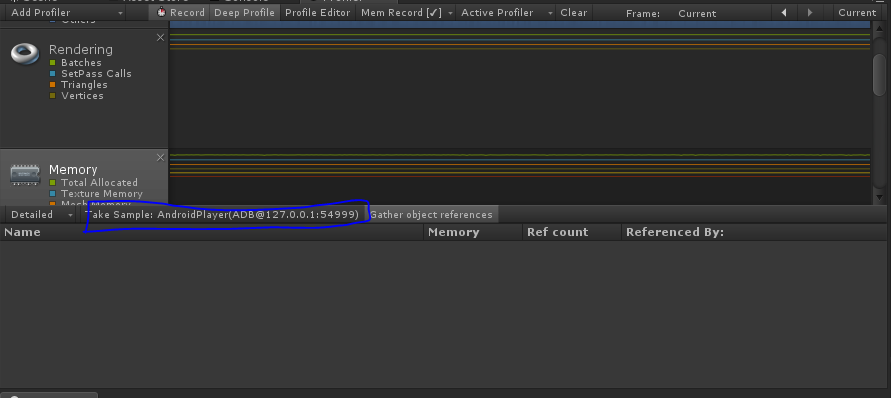
The "Take Sample" button in the profiler returns no results when running the profiler from an android build. The button changes to "Take Sample: Android Player(....)" so I'm guessing it should but there is an issue with my setup or Unity.

Has anyone successfully used this feature on a build and am I missing anything?
Thanks
Ali
It definitely works on device, as this is something I use at work weekly. Are you connected through a cable or wifi? You are sure that the profiler is connected as well (you are getting at least some data co$$anonymous$$g through)?
I personally use wifi with development build and auto connect profiler enabled, and have not had an issue with it in ages. Here is some more info that may be able to help you concerning the profiler.
Thanks for the Info. I tried it with both cable and wifi but no dice. Yeah, I get data co$$anonymous$$g through, the only issue is the Take Sample button.
A few follow up questions:
is there any error in the console window when you hit the "Take Sample" button ?
Does it happen on a particular device? have you tried other devices?
(may sound silly) but are you using the same editor version as the one used to build the game?
did you look at the logcat output? does it log anything interesting when hitting the take sample button ?
We've recently upgraded to 5.4.1f1 and are experiencing this issue as well. Detailed sample and taking a snapshot from $$anonymous$$emory Profiler tool returns no results on device on both Android and iOS. For the $$anonymous$$emory Profiler tool, the snapshot progress bar dialog remains open and appears to hang.
Profiling a new default scene seems to work fine, so I'm guessing some characteristic of our app no longer works with the memory profiler. The profiler was working fine with Unity 5.3.5p1.
We have the same issue. After y upgrading unity to 5.4.1f1 "Take Sample" button in profiler do nothing. This problem is reproduced on five different android devices with different versions of android.
Nothing interesting in editor log and adb logcat...does it log anything interesting when hitting the take sample button ?
Same problem here, since we've updated to 5.4.1 the Take Sample button does nothing on Android.
Same here, can't even connect to a Standalone Windows build on 5.4.1f1. When I click on Take Sample it makes my game hang, and when it starts responding the detailed memory profiler screen stays empty.
As of 5.4.3p1 this STILL hasn't been fixed. Did anyone create a bug report for that?
I am on 5.4.1p3 and having the same issue. It really does suck that we can't look at the detailed memory consumption.
Answer by faraz-glu · Dec 05, 2016 at 05:52 PM
I talked to some Unity Engineers last week about this issue and there is going to be a patch on 5.4.3 this week that fixes this issue.
The patch is out for anyone who is interested: 5.4.3p3 (836589 - Profiler: Fixed issue where taking detailed memory snapshot did not work in some circumstances.
Your answer

