How to solve performance issue with Camera.Renderer->Drawing ?
Hello Community,
I am working on a little casual game for mobile devices. Last weekend I was nearly ready to publish, but when I tested the app on an older android device, I realized, that the fps was most of the time around 15. I had tested older versions of my application, they were running fine with a normal fps rate. Unfortunately, I did not write a changelog or something like that, so I really don't know the reason for this performance issue. I tried to find the problem with the profiler (first time I use it), and on the problematic, older android device I found out, that the following process (shown in the overview of the profiler) needs about 50% of the CPU in nearly every frame:
The process is under Camera.Renderer -> Drawing -> Renderer.OpaqueGeometry -> RenderForwardOpaque.Renderer -> Clear
I would be really glad, if anyone could help me to find out, what this means, cause I have no idea at the moment :(,
jep7
And maby, it is helpful to mention, that when I profile the game on my PC, the 'Clear' process mentioned above only takes about 0.2%, nearly 40% are spend on Gfx.WaitForPresent. Which means, that the CPU has to wait for the GPU finishing his part, doesn't it?
you're right about WaitForPresent. But you shouldn't give anything about the profiler when it comes to your computer's performance, it's just way more powerful and won't help any with it's stats. Talking about it, the game view has a stats button in the top right. posting a screenshot along with your game during play would be a start.
Ok, here is a screenshot from the editor, but isn't it possible to say where I have to search for this 'Clear'-process mentioned above. When it takes gigantic 50% of my CPU, I have to optimize it, but where do I find that?

On my modern android device there isn't any problem, but when profiling on an older device it looks like that: 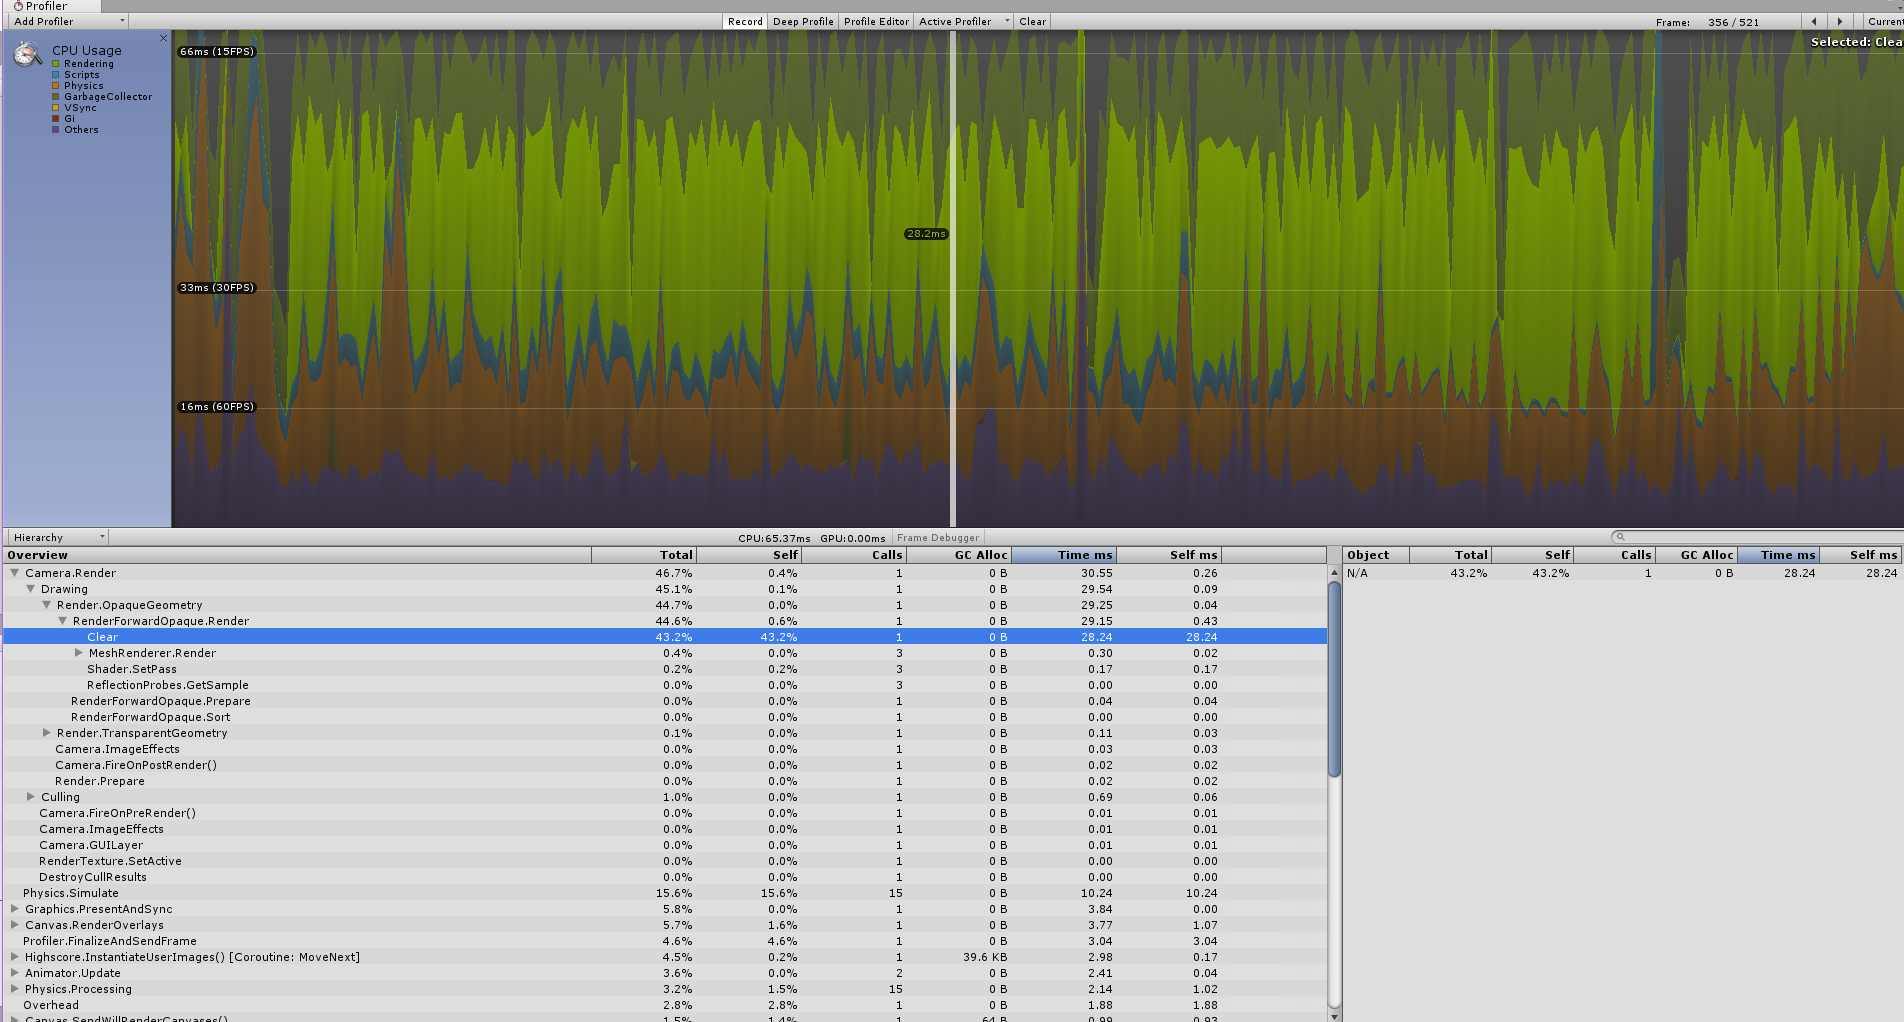
This is a representative frame, the Clear-Process always takes about 50%. What is this process? How can I improve it? (On my modern android device, the Clear-Process only took 0.2%, I really don't know, why it is taking so much on this older device (which is also not so old, it has android 4.4))
I am now experiencing this same issue as you had, did you ever find out what was causing the Clear function to consume so much, or how to potentially optimise it?
