Help reading Profiler
Hi! I am trying to optimize my CharacterController, so I copy/pasted 20 of it in my Scene and opened the Profiler window.
Previously I thought that Raycast operations were the ones that were causing my FPS to plummet to 20 when I had this many controllers on Scene; however, now I'm confused because it only says 7.4% on the Profiler Window, while Character.Update() says 94.5%.
Does this mean that Raycast are not hurting my performance, but some other operation in my Update()? If so, How do I track down the Function that is doing this?
Thank you in advance!
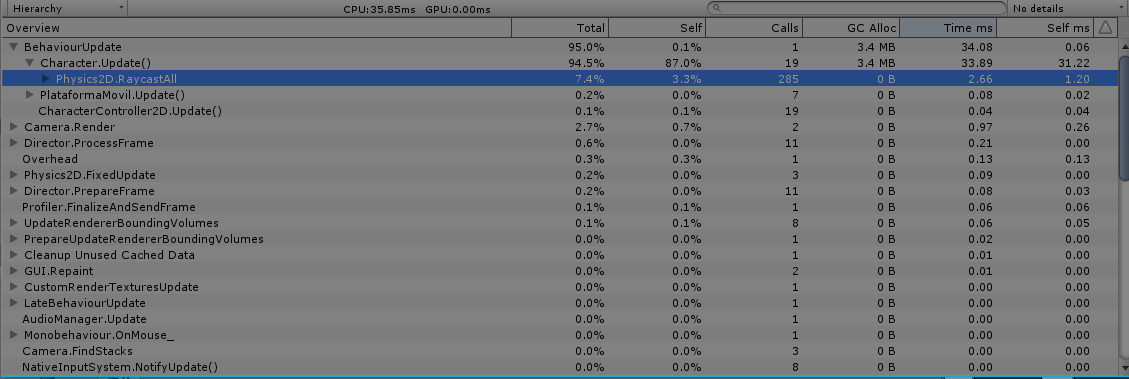
@DavidRochin Update() takes 31ms, Time spent = self ms + time spent in other function called. You can use Time.realTimeSinceStartUp to time your code in the Update() 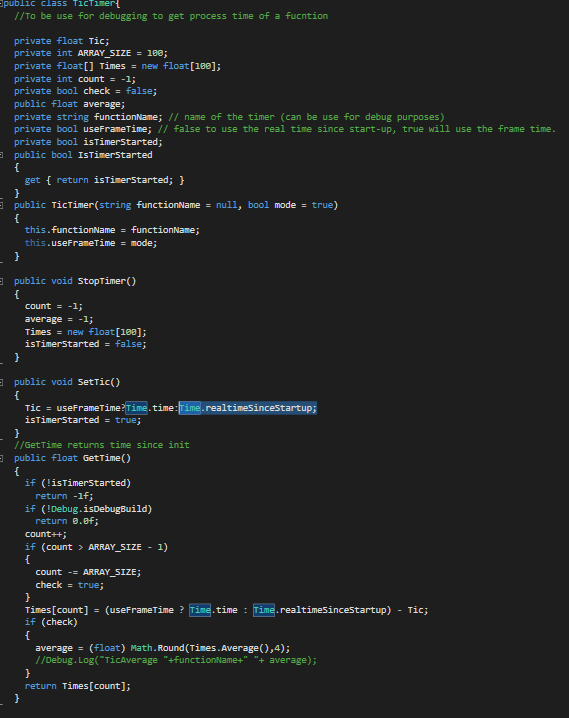
