Shader.Parse over 1000ms
Hello!
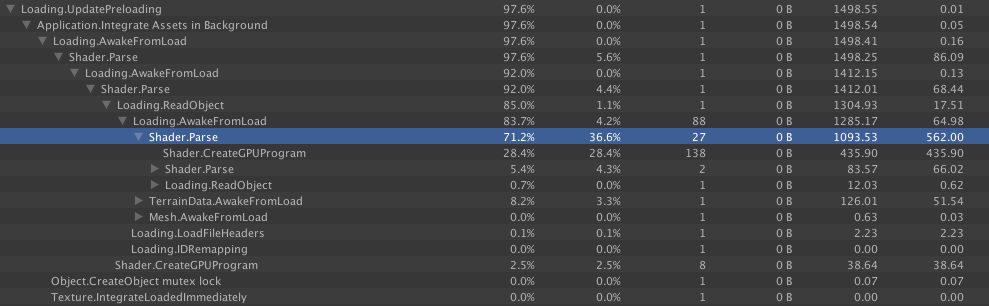
While running the profiler and loading level 1, there is an over 1000ms spike that is caused by Shader.Parse(562ms) and Shader.CreateGPUProgram (436ms).
What could be causing this
I don't know why Unity does this, but what Shader.Parse is doing is loading your shader(s).
I google Shader.Parse and literally i get is question clai$$anonymous$$g how unbelievably slow it is.
http://answers.unity3d.com/questions/465777/eli$$anonymous$$ate-cpu-spike-from-shader-load.html
http://forum.unity3d.com/threads/shader-parse-bad-performance.287202/
http://answers.unity3d.com/questions/810159/hang-while-loading-assets-shaderparse.html
its even been reported as a bug by some other users. What version of Unity are you using?
Yes I obviously googled first, but couldn't find a definite answer. Why is the spike so big?
I'm not sure , but it might have something to do with OpenGL
http://stackoverflow.com/questions/19974256/unity-shader-parser-error-syntax-error-at-line-19
This guy just switched to CG and it fixed itself lol. But it might be caused by shader errors too, if you have any, fix them.
I don't have Pro (yet) , so i don't have access to the profile. You could try reimporting some of your custom shader too.
