How to see duration (ms) and cost (kB) of tasks in the new 2018.3 profiler instead of "graph" display?
Hi
Just upgraded to 2018.3 from 2018.1. Was using Profiler to profile my application for Garbage Collection. It was possible to (in 2018.1 and previous versions) see the time an operation would take in milliseconds, for example you could see how much time each frame the garbage collector took and how much memory it would release (in kiloBytes) each frame on what tasks.
In the "new" 2018.3 (maybe 2018.2 also, did not test) profiler, i cant see the times, neither the cost of tasks. There is different "display mode" now, looks like a sliced graph.
example picture: 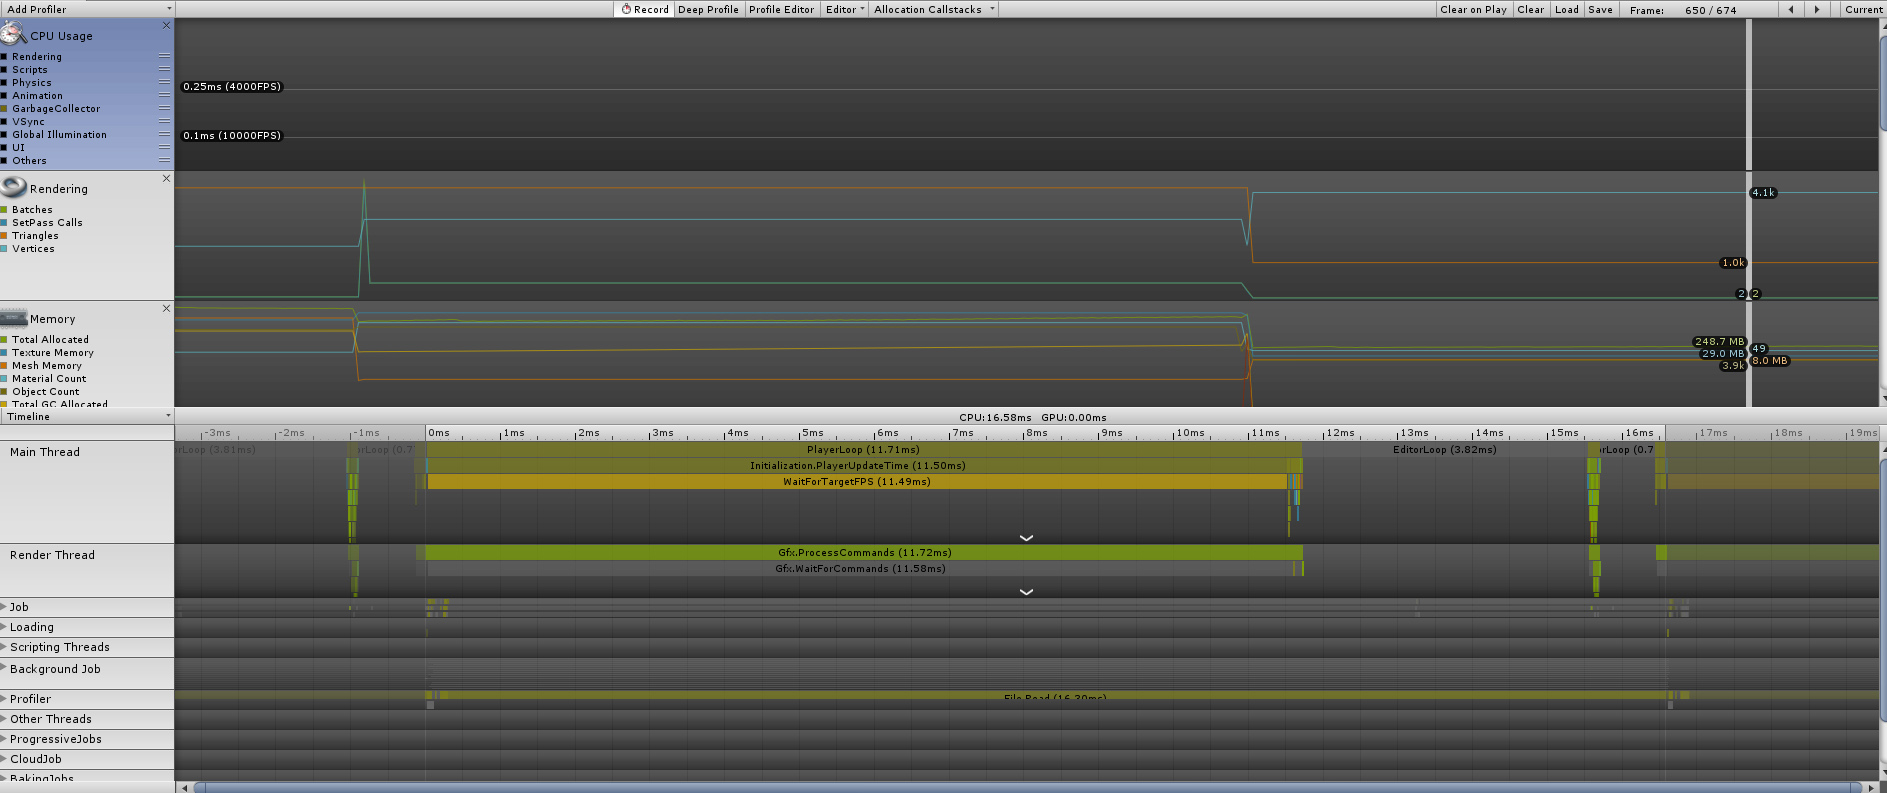 The actual slices of the graph represent the task duration, its flashy, but useless for my purposes - since the Garbage collection times and costs can be so small compared to everything else that happens within a frame. One can "click" the individual slices to see the times, but again, i cant click what i cant see. I also tried to disable all other display groups (like Physics, Rendering, etc), only kept the Garbage Collection one enabled, but its too small to see/click/debug).
Is there a way to get back to the old display/profiler?
It was easy actually. Top left lower part of the Profiler window, there is a "Timeline" foldout. Click that, and choose "Hierarchy".
