Massive memory leak in "Not Saved" (Unity 2017.1)
Ok, So I don't know much about memory, but this seems odd.
I'm currently working on a medium sized project, but the scene setup is very simple. I noticed that, when working on it for a long time, the framerate drops from an initial average of 70-80 fps to about 40-50. So I checked the profiler and found this in the memory section: "Not Saved", along with "Other", were both taking up about 4.5 GB of memory. The "Other" seemed OK, but under "Not Saved/Mesh" there was one "Shared UI Mesh" taking up more than 1.5 GB of memory! There were also a bunch of other, empty entries, but those weren't even remotely that big.
I did some research on this topic, but found nothing useful really. And no, I am not using any plugins like NGUI or MeshBaker. As for setting Text.text, I use it, but not every frame (e.g when player clicks something, you get the idea).
So my question to you is: Does anyone of you also experience this? Have you found a fix for it? Any advice about what i should do to track down the memory leak?
I am using Unity 2017.1.0f3 on Windows 10; 16 GB RAM, SSD, i7 4790k, GTX 1080. I highly doubt my hardware is bottlenecking anything.
I'm looking forward to any sort of answer ;)
Sorry, image upload not working for me atm.
Edit: It really is some sort of problem with the UI System (I'm using Unity's new (4.6) UI System). It looks like too many buttons (I used them for inventory slots) causes massive frame drops. With a bunch of buttons etc. I get 40 fps, if I disable all the UI in my game, I get 90+fps. Anyone knowing more about this?
It seems to be happening when calling SetAllDirty() or SetVerticesDirty() inside a class that is extending Graphic.
It was a known bug in Unity 2017.1. There is a patch release that fixes it. Download it and you will be fine - Unity 2017.1.0p2
Sorry for not posting anything for so long, but I have recently found out that having pixel perfect enabled amplifies the memory leak / performance drop a lot. I had only one canvas with some panels and texts, with pixel perfect: average 50 fps; without pixel perfect: average 80 fps. I hope Unity 2017.2 stable is released soon and that the issue will be fixed.
Got the same problem but on iOs
Look at Mesh size after launch 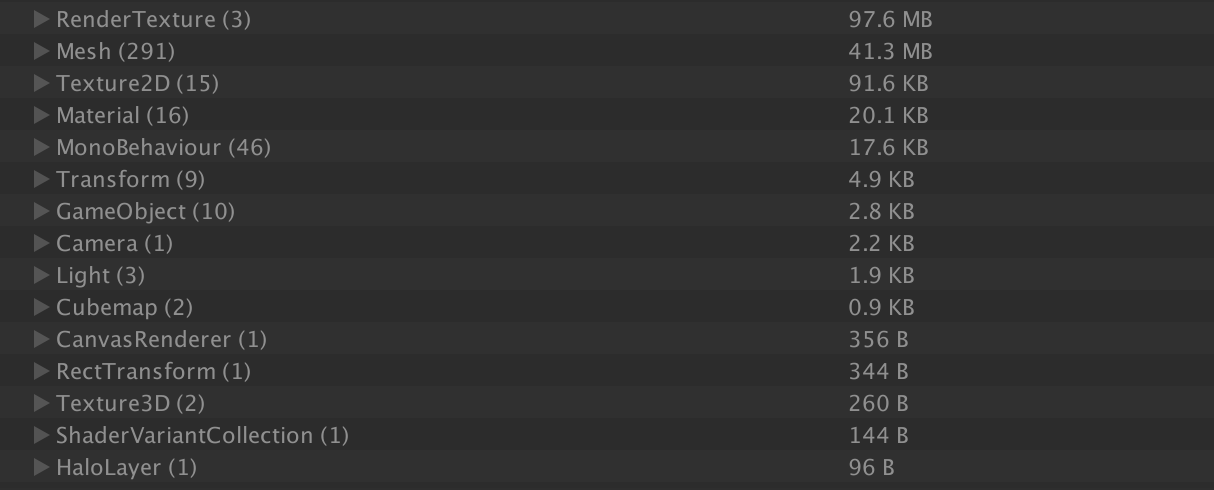 And this is the size after 3 levels( 3 times reloading scene)
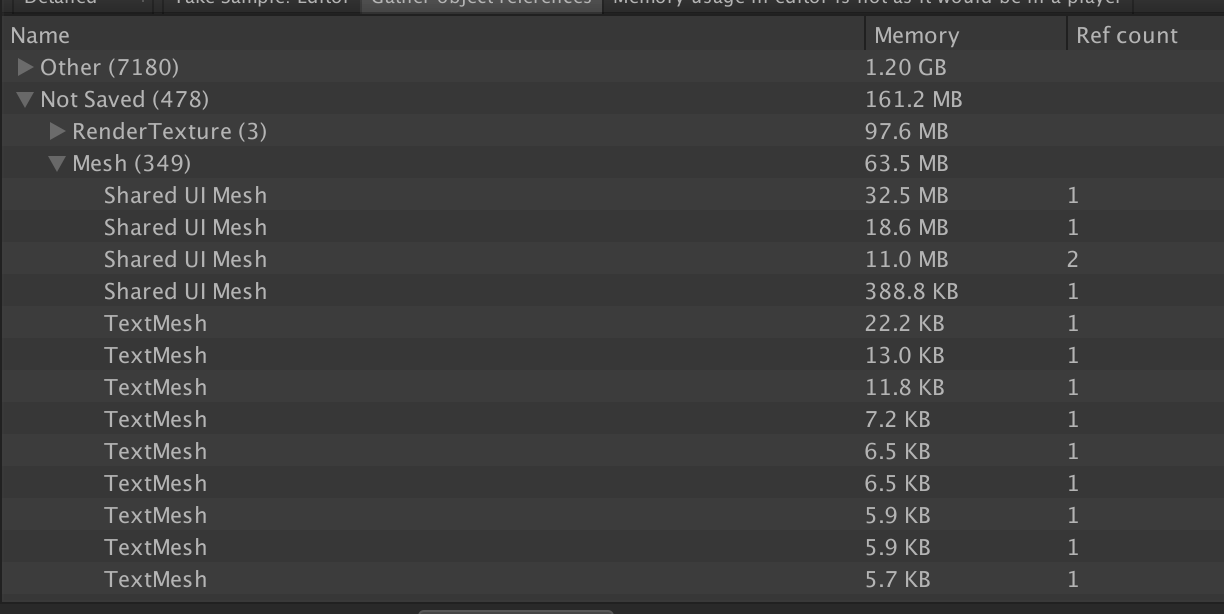
Yeah looks just like what I experience. Hope we find a solution soon!
Same issue. After bug report Unity Developers promised it will fixed on 2017.2 Stable version...
At least we know Unity knows about the bug. I would also be interested in the link though.
I had same problem and I'm pretty sure that it's a bug, When new scene starts I noticed memory leak problem 1 Gb in less of two minutes to be precise. The problem derive from my canvas UI, I deactivated Pixel Perfect checkBox and magically the memory leak is disappeared.
Yes, I found that as well. It doesn't eli$$anonymous$$ate the problem, but certainly reduces the memory leak. What I noticed as well was that using Text.text also contributes to the memory leak.
I have the same exact issue, which started happening after upgrade to 2017.
I use Text.text a lot in my game, and the SharedUI Mesh leak is massive. (like 1GB in 10 minutes )
Dowgrading to 5.6.2 fixed it on my side.
The issue is also present on 2017.2.b4
Sounds like a plan, but can you actually use a Unity 2017.1 project in a previous version? Doesn't Unity always display a message saying you can't go back before upgrading?
Yeah, but I guess you can always do that manually: Creating a new project in the older version and just copying the asset files. In the worst case you might have to rebuild some setups/prefabs and of course the project settings.
