VRAM Usage Breakdown
Hi, I am trying to track down exactly what makes up the total of memory listed in the profiler's Rendering window. Here is what I got from the profiler:
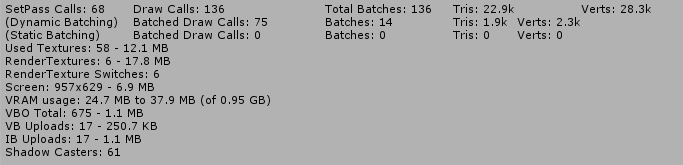
So the total VRAM memory usage in the image is listed as 37.9mb. When you add 12.1 (Textures) plus 17.8 (RenderTextures) plus 6.9 (Screen) plus 1.1 (VBO total) it equals out to be 37.9 mb matching the VRAM total.
I am trying to figure out where these numbers come from as they do not match the numbers in my Memory profiler window. There are far more textures listed, and only 1 single RenderTexture was listed that only represents 6mb of the total. Is there a way to track down the individual assets that make up the 58 Textures, 6 RenderTextures, etc. listed in this window? Thanks!
hmmm...interesting.
