Interpreting Profiler data
As a newbie to Unity development, looking for an expert opinion here on what I see in the app profiler:
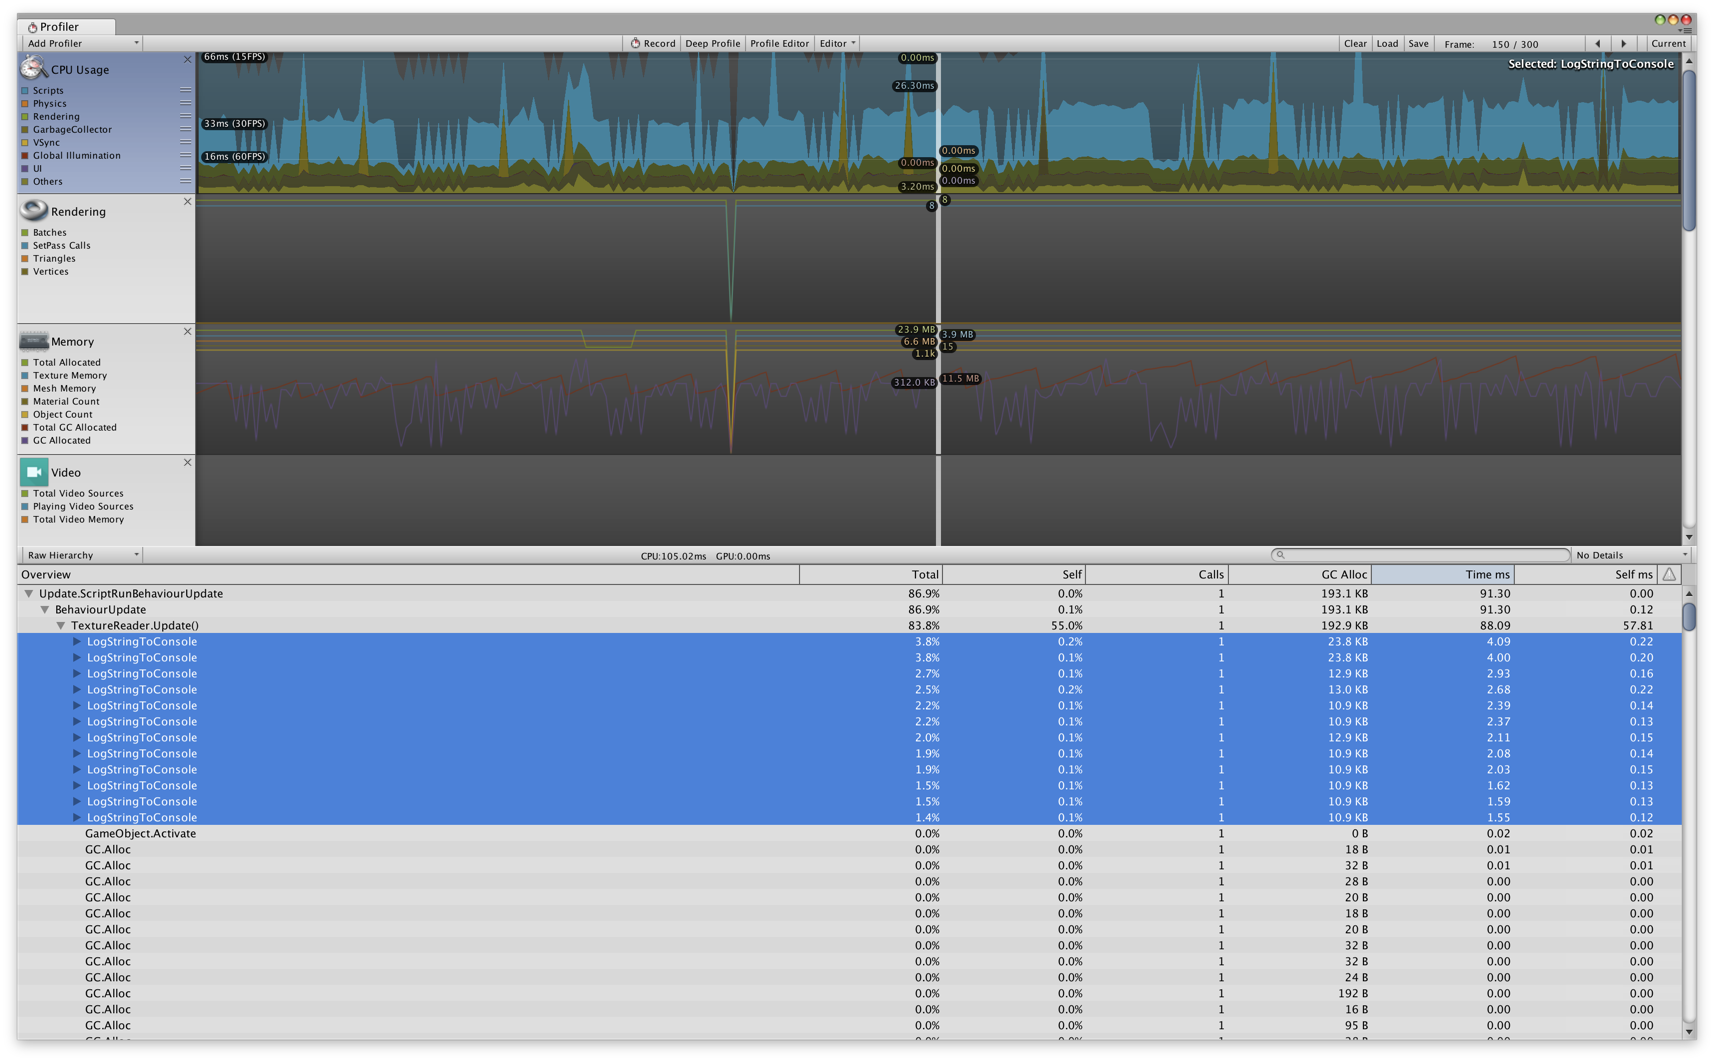
Is the problem is too much logging in the code that eats up milliseconds? Or too many objects get allocated (GC.Alloc)? Or both?
Thanks,
screen-shot-2018-06-04-at-55233-pm-copy.png
(515.2 kB)
Comment
Your answer
Follow this Question
Related Questions
Huge Physics Spikes (In empty scene and populated scene) 6 Answers
iOS high memory textures 0 Answers
Prefabs.MergePrefabs on entering PlayMode takes almost 4 minutes 1 Answer
CullScriptable CreateSharedRenderScene eats up CPU 0 Answers
Why does my fps drop when objects are loaded? (Android) 0 Answers