Need help profiling first game. Huge GPU spikes?
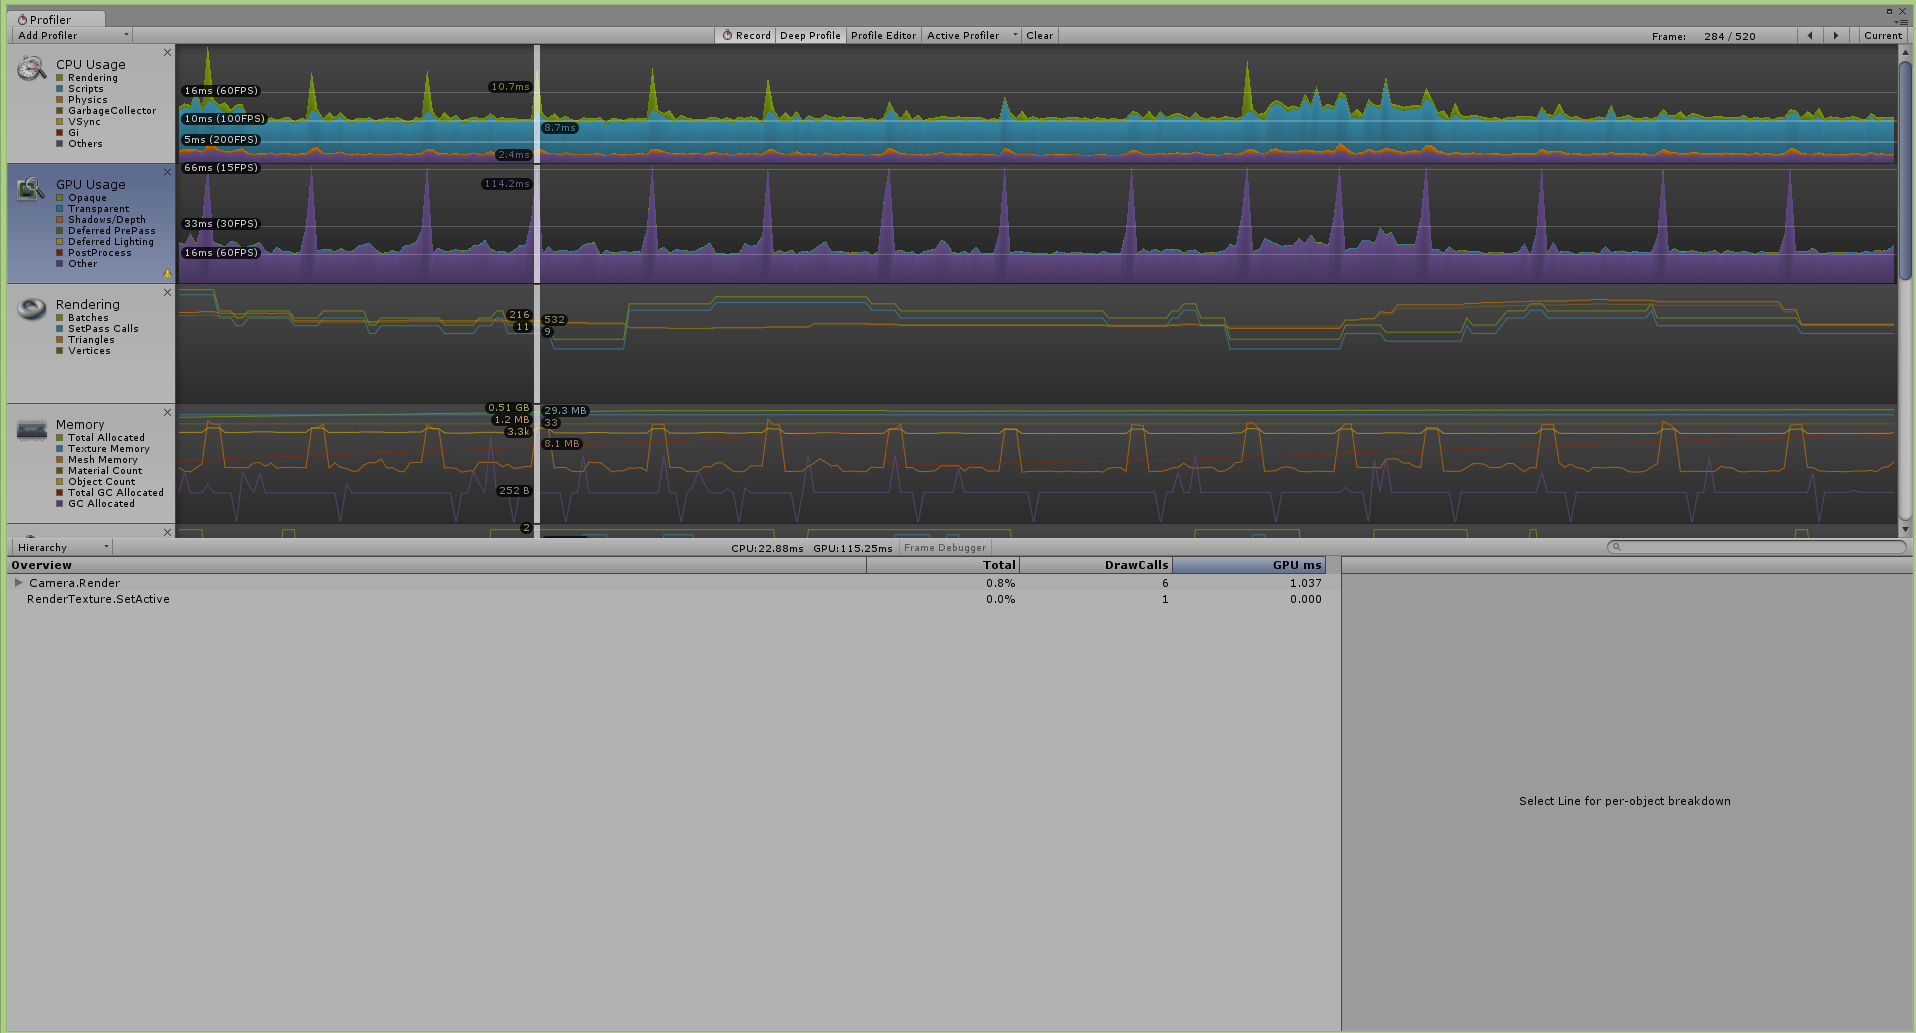
Hello, I am creating my first game ever using Unity. It is a 2D platform game designed for android devices. I finished the game a few days ago and I tried testing it in BlueStacks and I was horrified by the poor performance. On my android phone the game runs somewhat smoothly but with a few "hickups" every few seconds. I have never before used the profiler and I can't find any good tutorial to help me out. Here is a sequence recorded with the profiler during gameplay.

What first caught my eye are those huge spikes in the GPU usage taking up more than 100 ms of the GPU. Surely that can't be good but I have no clue why it is like that. Any help to improve my game's performance or explaining what those GPU spikes could be would be very much appreciated. Thank you in advance!
Answer by Cepheid · Jul 27, 2016 at 03:17 PM
Hi @OttoClausen
I'm afraid we'd need a lot more information than just a small screen shot GPU spike. Poor performance comes down to hundreds of areas of development. We'd need to know how many batch calls Unity is making, how many instantiations of objects there are, how much is drawn on screen at once, what physics equations you are using, how effective your memory management is etc. That's just for starters!
A lot of this is not complete rocket science however, you can do a large amount quite simply by yourself. If you need some help on the profile window please consult these tutorials:
Profiler Documentation - Unity Docs
Profiler for Beginners - Unity Live Session
As well as that, there are some tutorials on optimizations you can make in your game. Things such as ensuring you are making use of static batching, using texture atlas's for sprites. LOD's, Occlusion Culling etc. Some quick tutorials I could find which help on the subject are:
Graphics Performance - Unity Docs
After having consulted these and if you are still unsure. Then please consult the unity forums for information as there are many threads which are about specific areas of optimization for mobiles. If you need some specific help, then feel free to create another question asking about your specific problem.
I'm sorry I couldn't be of more direct help to you, I hope this helps set you on your way though! Good luck. :)
Thank you for the answer! I will definetely look into those links. Just to be clear, am I correct that those big spikes in GPU does not do any good for game? I mean 100+ ms surely that must be part of the reason why my game is not doing as well as I would like it to
Yes, definitely. The GPU spikes themselves are most likely a major part of the issue. I didn't mean to detract from that. I would look into how many draw calls your game is having to make as well as how many materials/sprites you are using. If you're making use of Unity's GUI rather than the I$$anonymous$$GUI then I would look into checking how many of the draw calls are co$$anonymous$$g from that as well. :)
Your answer

Follow this Question
Related Questions
GPU profiling time not adding up properly and GPU taking up lots of time 2 Answers
Physics2D lag on increased timescale 1 Answer
GPU spike from RenderTexture.SetActive 0 Answers
GPU spikes in profiler - used to be 100fps, now 30fps? 1 Answer
Massive Rendering spike in profiler when unloading the scene 0 Answers
